People often ask us for an overview of how TagoIO works. We kept putting off the answer because we kept evolving the platform. Now that the architecture has matured, and analytics has grown from custom scripts into forecasts and predictions built into the platform, it is time to share the complete picture.
We will walk through the entire TagoIO system from bottom to top, the same way we built it (skipping the experimental paths we took along the way). By the end, you should understand how production-ready IoT solutions get built on TagoIO. You will not need to start from scratch, either: the platform has a flexible free plan and handles the infrastructure for you.
The Foundation
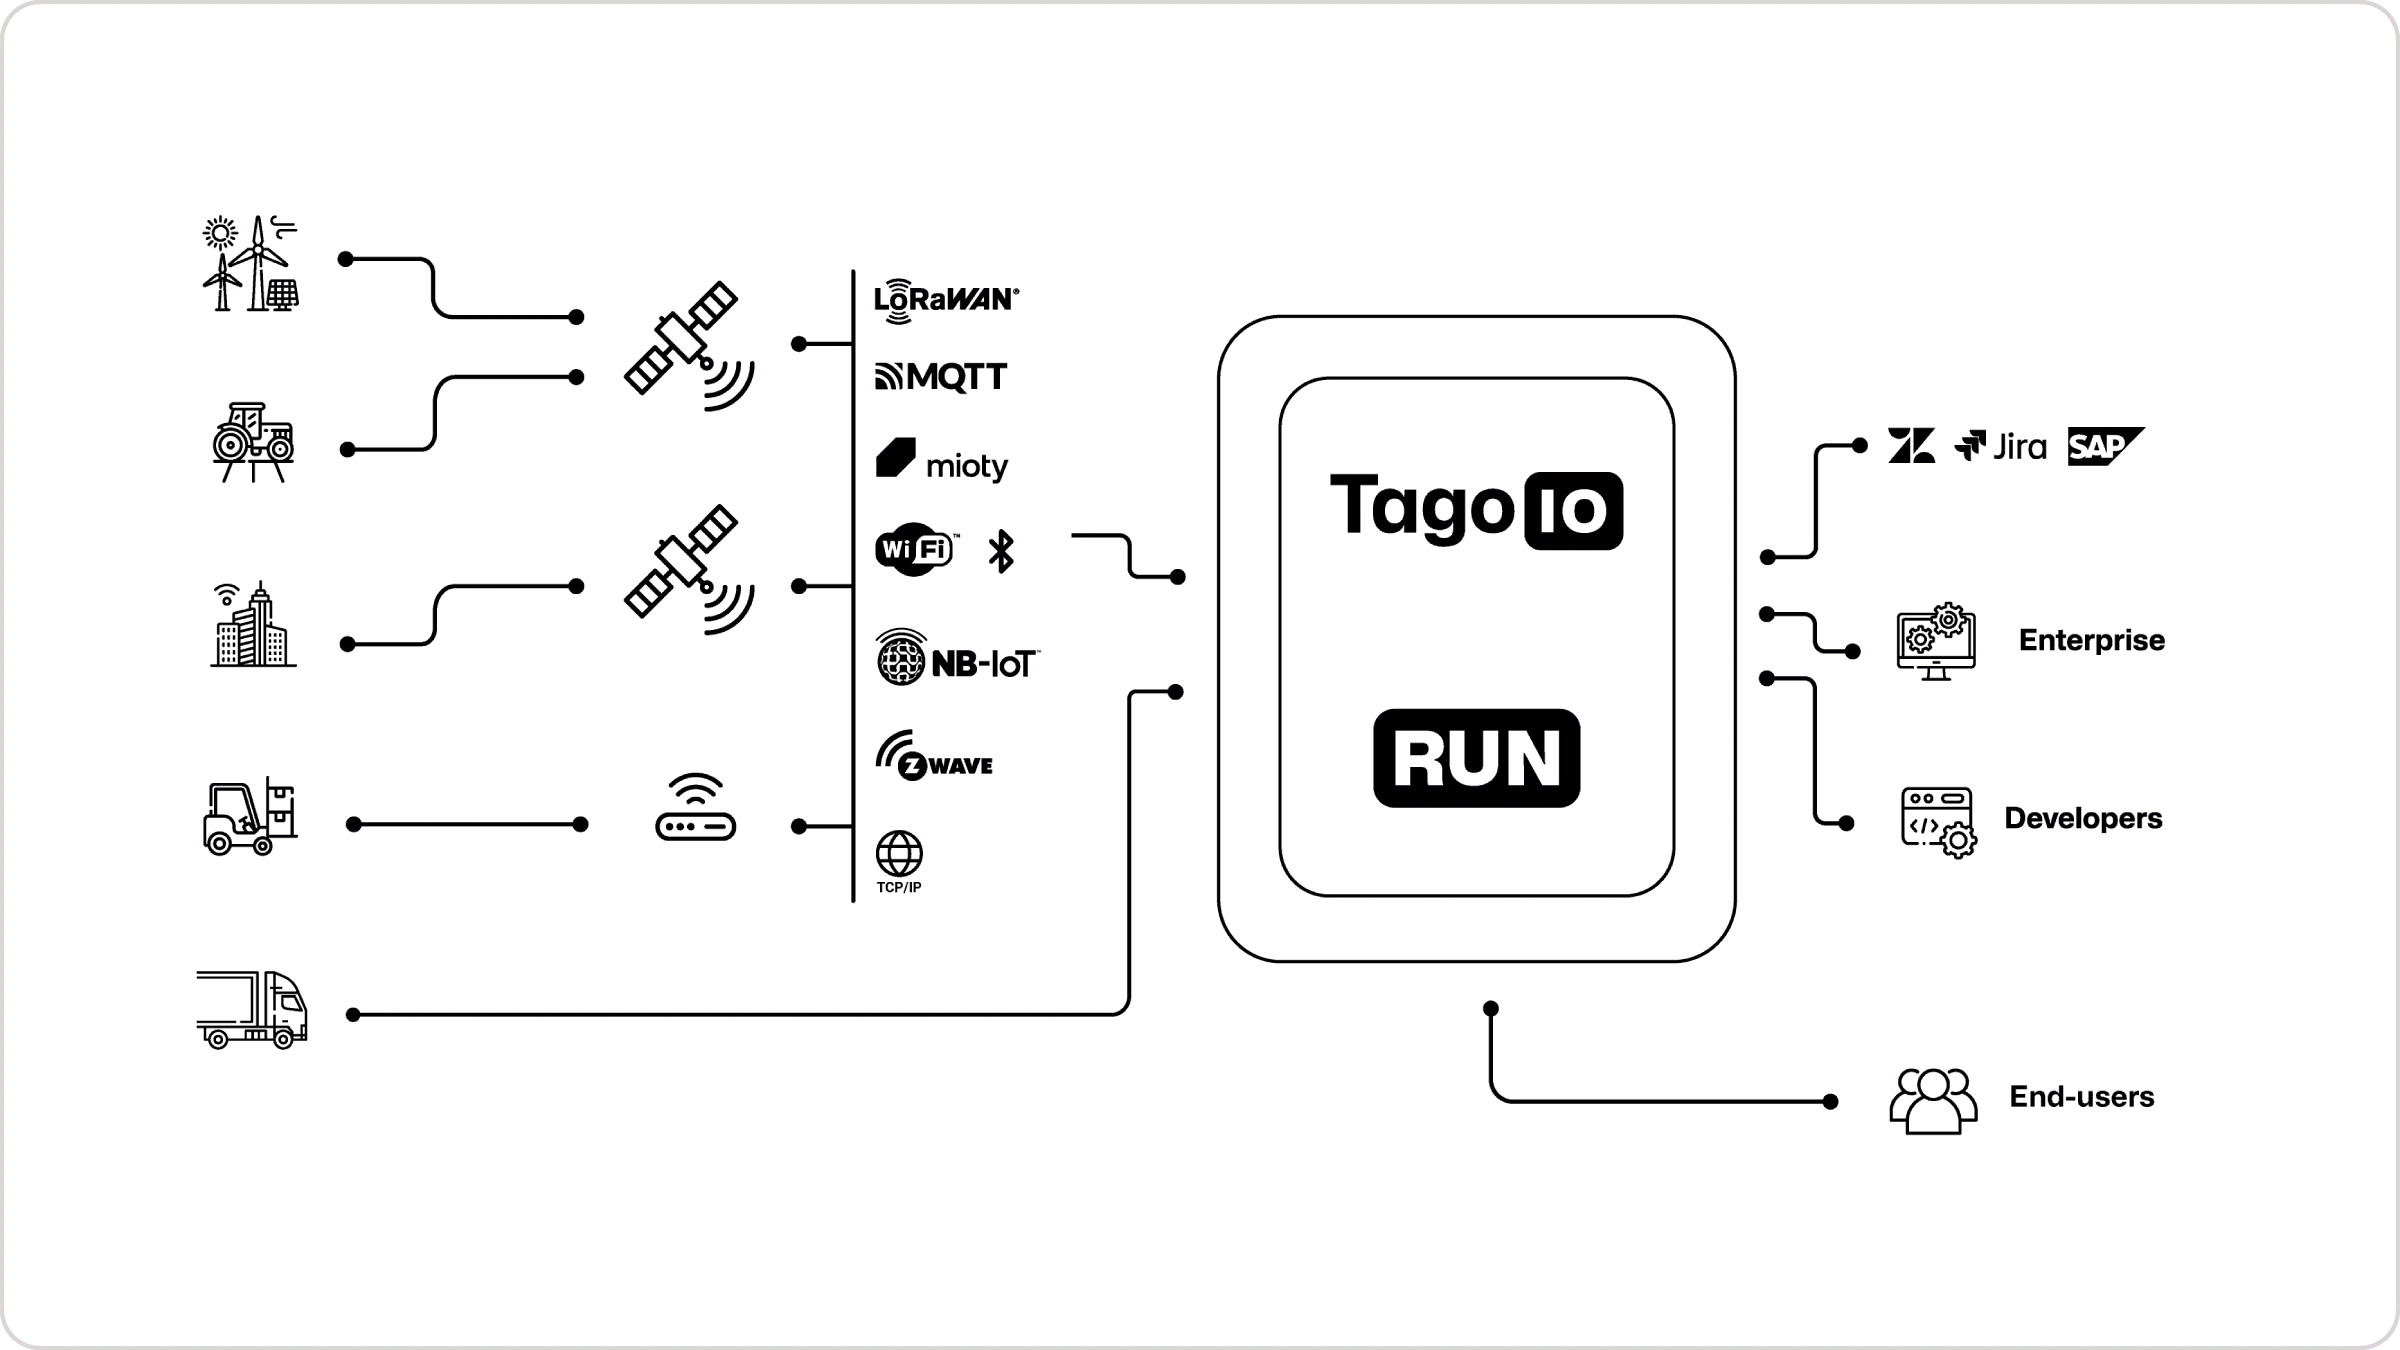
Our base layer accepts data from virtually any IoT device, regardless of protocol. TagoIO supports over 500 types of IoT devices through two fundamental components: Networks and Connectors.
A Network represents the communication protocol or integration method: LoRaWAN, NB-IoT, CAT-1, CAT-M, Sigfox, BLE, WiFi, MQTT, HTTP, and satellite networks like Myriota, Skylo, or Kinéis. A Connector is the pre-configured decoder that knows how to parse data from a specific device manufacturer.
The result: when your temperature sensor sends data via LoRaWAN, your GPS tracker transmits via satellite, or your industrial equipment reports via MQTT, TagoIO routes that data through the right network integration and connector, and it arrives decoded in a standardized format.
Why This Matters: The Traditional Approach
IoT developers traditionally face a painful integration problem. Imagine a smart city solution with:
- Environmental sensors using LoRaWAN
- Traffic cameras sending analyzed data via HTTP
- Smart meters communicating through NB-IoT
- Legacy equipment that only speaks Modbus
Without a platform, you would need to:
- Build separate backend endpoints for each protocol
- Write custom parsers for each manufacturer’s data format
- Maintain different database schemas for different device types
- Create multiple authentication systems
- Build redundant visualization and alerting for each device type
That is a mountain of infrastructure work before you start on your actual application.
The TagoIO Approach: Unified Device Management
TagoIO provides a single pipeline. When a device sends data:
- Device transmits data using its native protocol (LoRaWAN, HTTP POST, MQTT publish, and so on)
- Network integration receives the data at TagoIO’s global endpoints
- Connector decodes the manufacturer-specific payload into standard variables
- Device bucket stores the decoded data in optimized time-series storage
- Your application can immediately access, visualize, predict from, and act on this data
Whether you run 10 devices or 10,000 devices across 20 protocols, they all flow through the same pipeline. You write your application logic once, and it works across every device type.
The Data Layer: Flexible Storage Architecture
Once data arrives, it is stored efficiently. TagoIO offers two storage architectures for high-volume IoT data, each optimized for different use cases.
Mutable Devices: Traditional IoT Storage
Mutable devices work like a traditional database table: each data point can be created, read, updated, or deleted. They fit:
- Configuration parameters that change occasionally
- Device metadata and status information
- Small to medium deployments
- Applications requiring full CRUD operations
- Up to 50,000 data registers
Think of mutable devices as the flexible option for applications that do not expect massive data volumes.
Immutable Devices: High-Performance Time-Series
Immutable devices are built for high-throughput sensor data. Once written, data can only be created and read, never modified. That architectural decision buys large performance gains:
- 10-100x faster ingestion compared to mutable storage
- Automatic data retention policies (chunk by day, week, month, or quarter)
- Optimized queries for time-series analysis
- Lower storage costs at scale
Collecting GPS coordinates every 10 seconds, temperature readings every minute, or industrial sensor data at high frequency? Immutable devices handle millions of data points without strain. This is also the storage that feeds TagoIO’s analytics: clean, ordered time-series is exactly what forecasting models want.
The choice is not either/or. Many solutions use immutable devices for high-volume telemetry and mutable devices for configuration and metadata.
Entities: Next-Generation Database
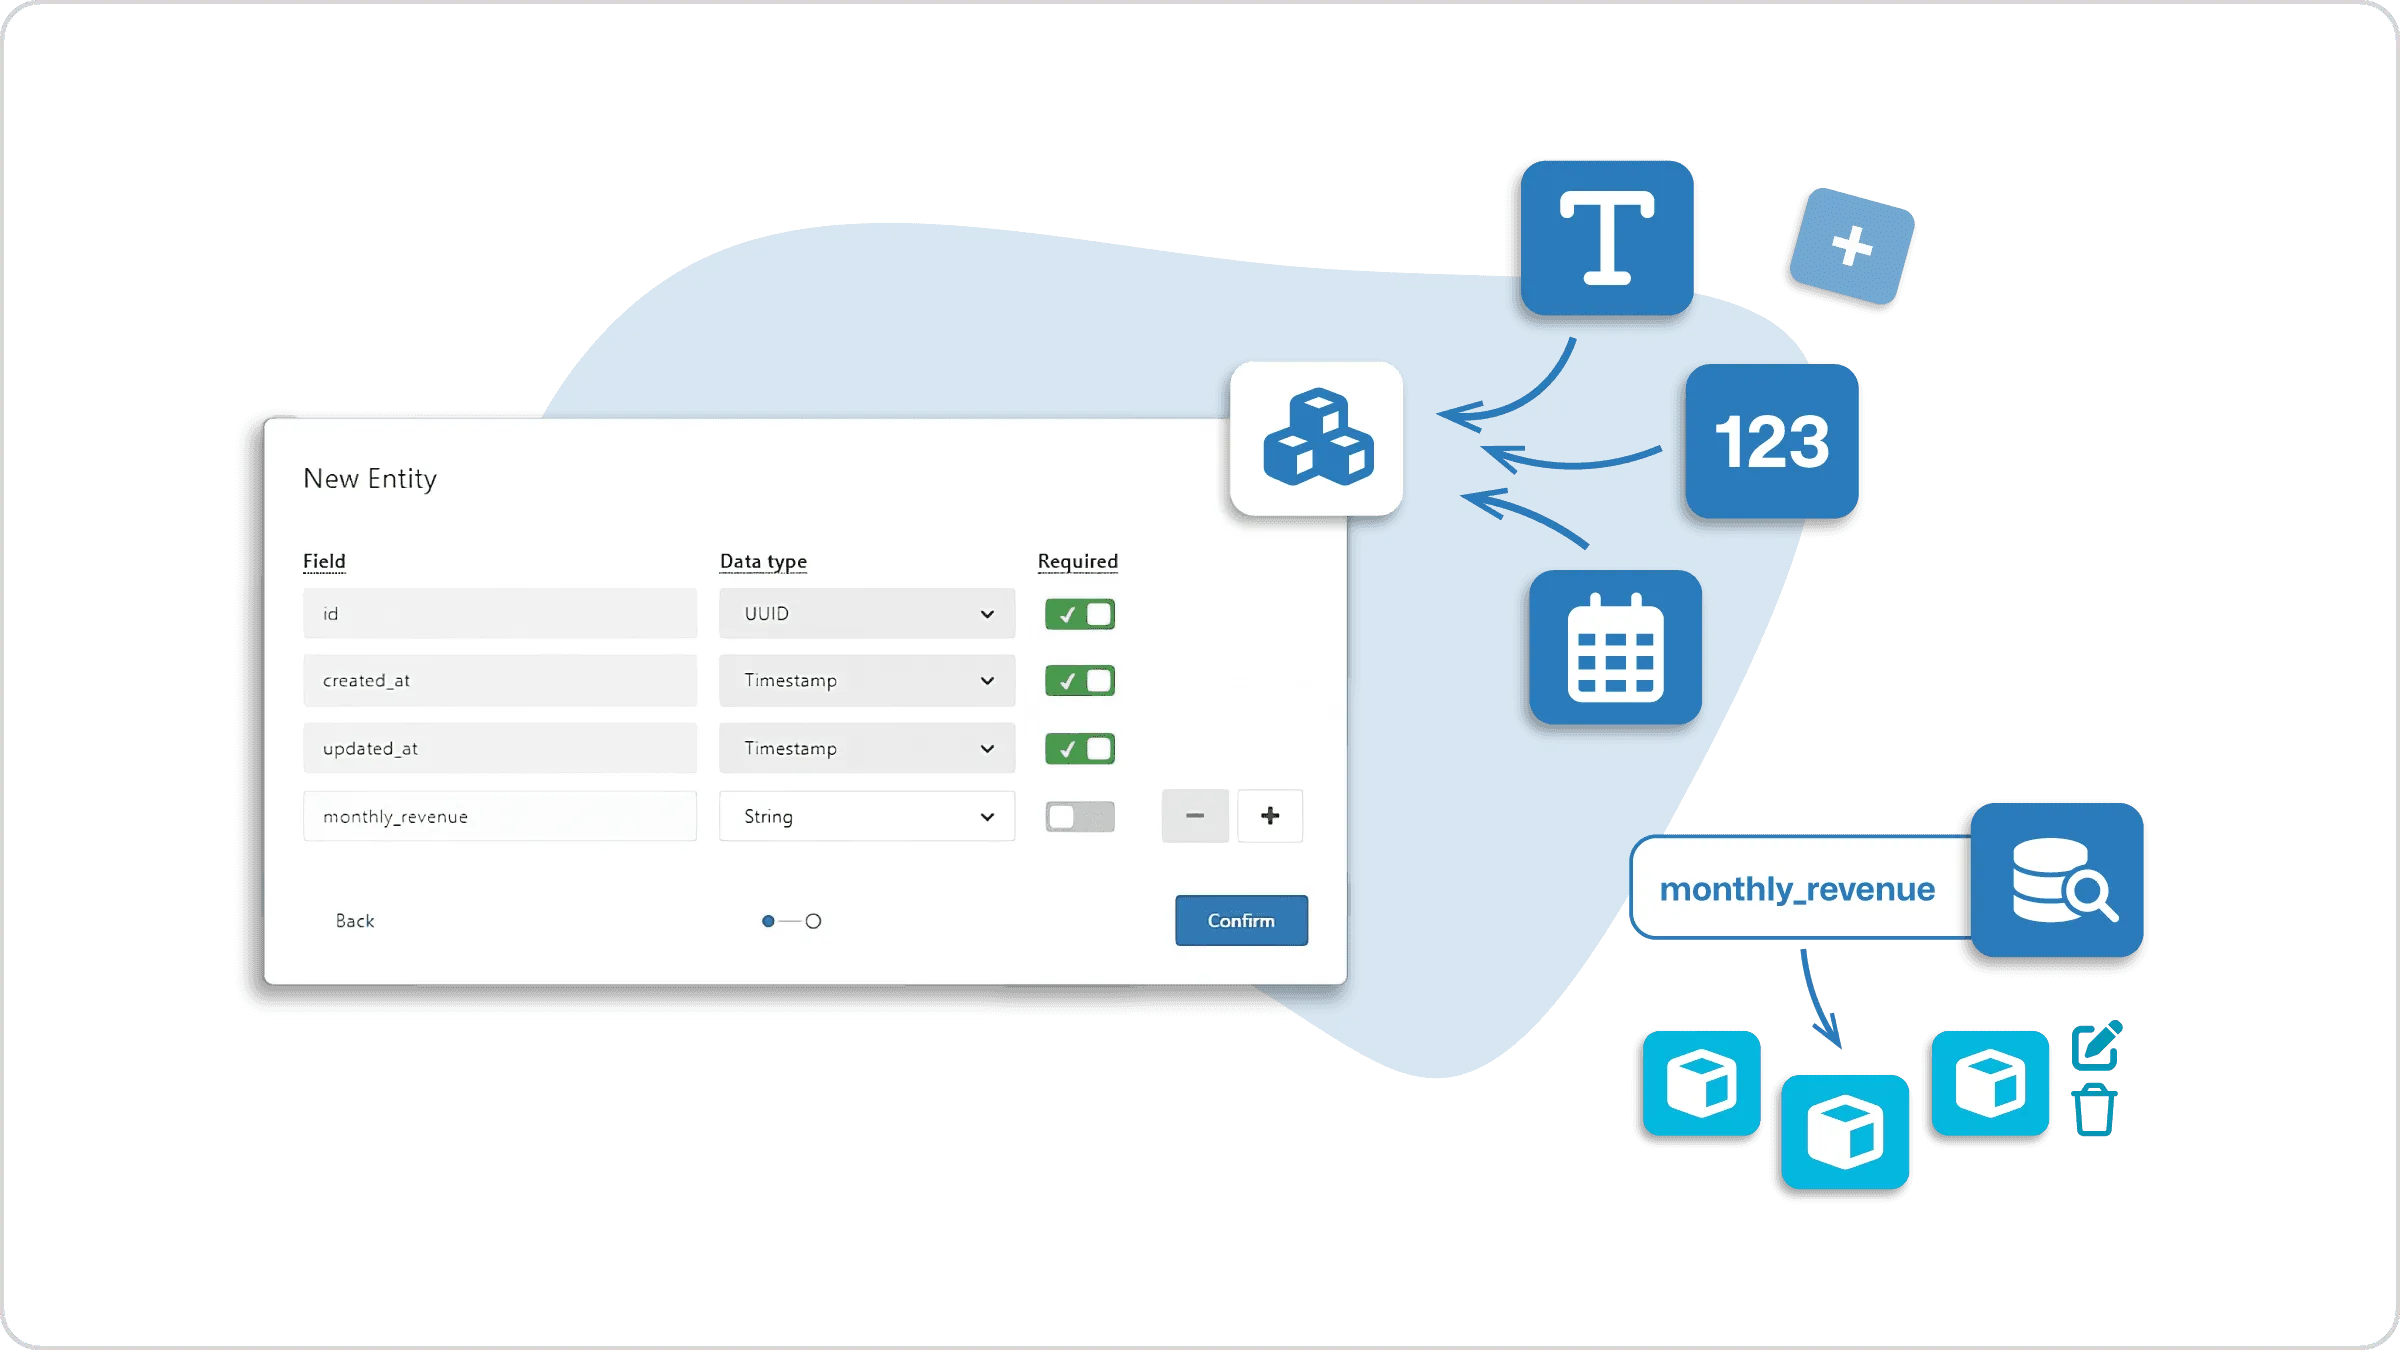
For data that does not fit the time-series model, TagoIO offers Entities, our structured database system:
- Custom schemas with flexible field types
- Relational data modeling
- Advanced querying and filtering
- High-performance operations on structured data
Entities suit asset management systems, inventory tracking, user profiles, work orders, or any structure beyond sensor readings.
Note: The combination of mutable devices, immutable devices, and entities lets you optimize storage per data type: immutable for high-frequency telemetry, mutable for configuration and metadata, entities for relational structures. That flexibility is key to applications that scale efficiently.
The Intelligence Layer: Analysis, Analytics, and Automation
Collecting and storing data is the beginning. The value comes from what the platform does with it. TagoIO’s intelligence layer has three parts: Analysis for custom code, analytics for forecasts and predictions, and Actions for automation.
Analysis: Serverless Compute for IoT
Analysis provides a serverless environment where your code runs in response to events, in Node.js, Deno, or Python. Think AWS Lambda, but designed for IoT workflows.
Each Analysis is a script that can:
- Process incoming device data in real time
- Make decisions based on sensor readings
- Call external APIs and services
- Write data back to devices
- Trigger workflows across your entire IoT setup
For example, an Analysis might:
- Monitor temperature sensors across a factory
- Calculate rolling averages and anomaly scores
- Check readings against safety thresholds
- Send alerts when conditions are abnormal
- Adjust HVAC systems to compensate
Analysis scripts run in the cloud, triggered by device events, schedules, or API calls. No servers, containers, or infrastructure to manage. You write the logic, the platform runs it. Python scripts can use libraries like pandas, numpy, and scipy, which matters for the statistical work IoT projects grow into.
Predictive Analytics: Forecasts, Not Just History
Dashboards tell you what already happened. TagoIO’s analytics turn the telemetry you are already storing into what happens next:
- Forecasts project a variable forward: silo levels before they run empty, energy consumption before the bill arrives, battery life before the maintenance window.
- Anomaly detection flags behavior that drifts from a device’s own baseline, the day it starts drifting, instead of after the threshold alarm finally trips.
- Predictions score risk from patterns across your fleet: which pump is trending toward failure, which site will miss its compliance window.
These run on the data already in your buckets. No separate ML pipeline, no data warehouse export, no data science team required. Predictions and anomaly scores land in the platform as variables, so everything else in this article applies to them: chart them on dashboards, trigger Actions from them, expose them to your customers through TagoRUN, and refine them with your own Analysis code when a use case needs custom modeling.
A concrete example: a feed-bin monitoring solution stores weight telemetry in immutable buckets, analytics forecasts days-to-empty per bin, an Action opens a resupply order in the ERP when the forecast crosses four days, and the customer watches the forecast band on their branded portal. That loop, telemetry to forecast to action to customer, is the pattern the platform was built for.
Actions: Event-Driven Automation
While Analysis and analytics handle computation, Actions handle automation: if-this-then-that rules that trigger automatically.
Actions can be triggered by:
- Device data conditions: temperature exceeds a threshold, GPS enters a geofence, battery drops below 20%, an anomaly score crosses a limit
- Resource events: new device created, user account modified, file uploaded
- Time-based schedules: daily reports, weekly summaries, monthly aggregations
- Usage alerts: approaching data limits, API quota warnings
When triggered, Actions can:
- Run Analysis scripts
- Send emails, SMS, or push notifications
- Post to external webhooks
- Publish MQTT messages
- Send WhatsApp messages via Twilio
- Queue tasks to AWS SQS
You define the business logic once; TagoIO monitors, triggers, and executes 24/7.
The Visualization Layer: Dashboards and Widgets
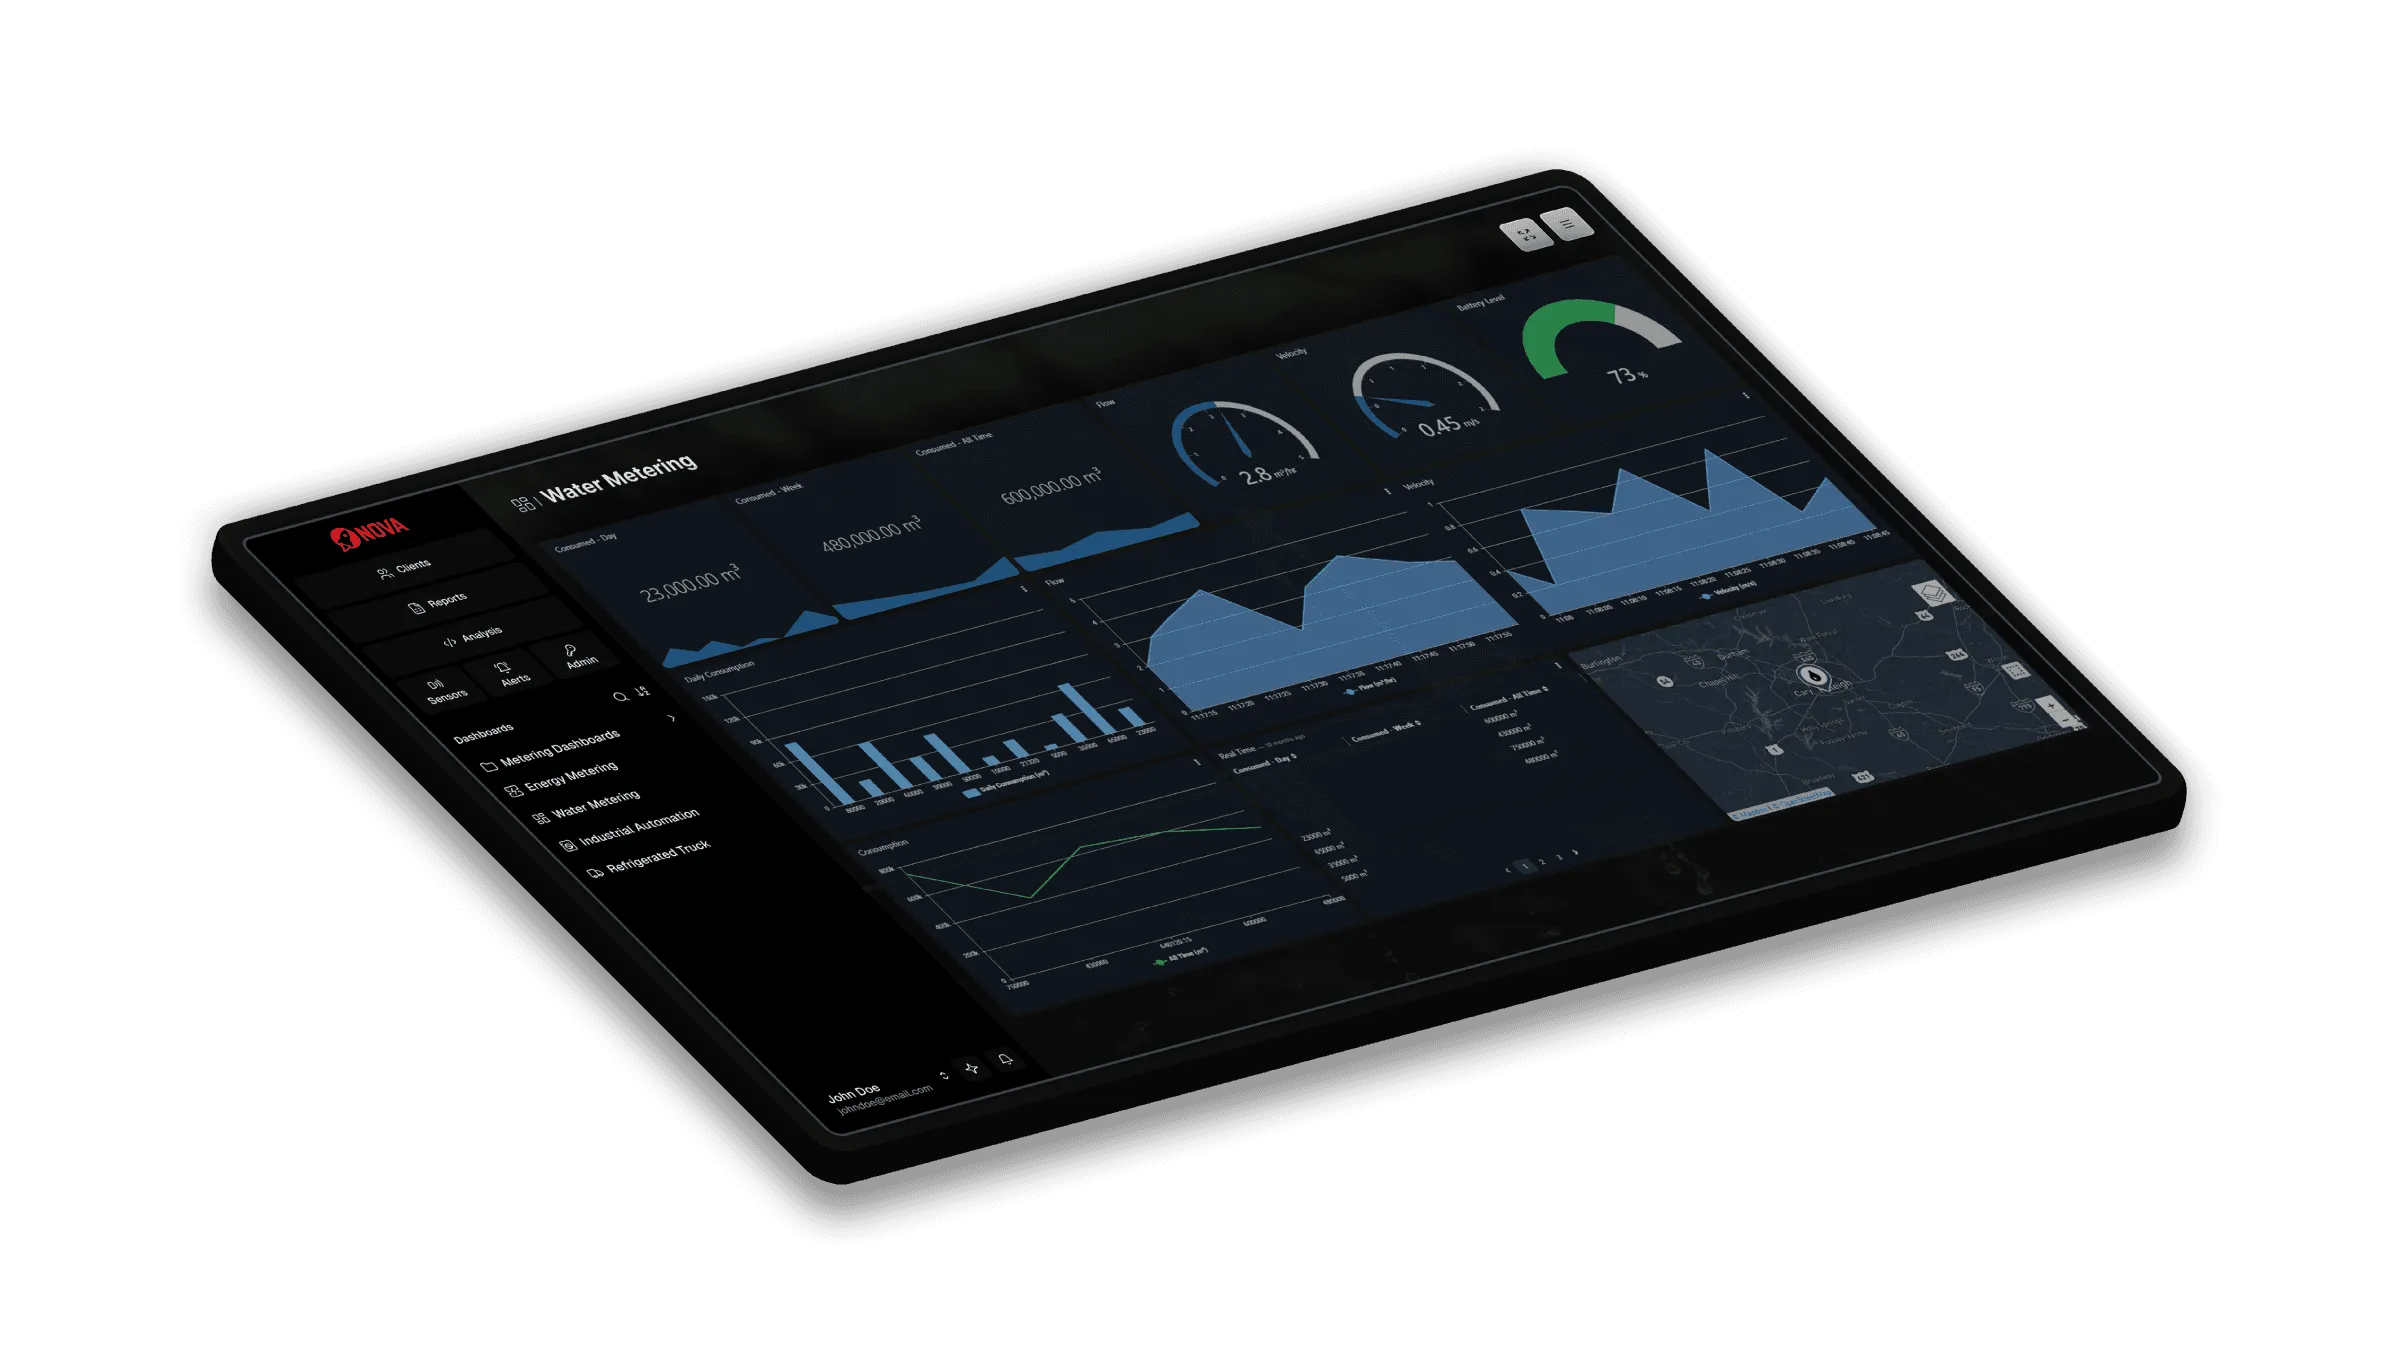
Data, forecasts, and automation mean little if users cannot see and interact with them. TagoIO’s Dashboard system is the visualization layer.
Drag-and-Drop Dashboard Builder
Creating dashboards requires no front-end development. The visual builder lets you:
- Drag widgets onto a canvas
- Configure data sources with a few clicks
- Customize colors, layouts, and styling
- Add interactivity and user controls
- Deploy to users instantly
Dozens of pre-built widgets are included: real-time charts (line, bar, column, gauge, donut), maps with device tracking, tables with filtering and sorting, input forms for device control, and custom HTML for specialized needs. Forecast and anomaly outputs render on the same charts as live telemetry, so a single line chart can show what the sensor read and where it is heading.
The critical feature is the Blueprint system: build one dashboard template, deploy it automatically to hundreds or thousands of devices, and update every instance by updating the blueprint. This is how a proof-of-concept scales to production with thousands of end users.
TagoRUN: White-Label Deployment
When you are ready to put the solution in front of customers, TagoRUN turns your TagoIO application into a fully white-labeled product:
- Your own custom domain (app.yourcompany.com)
- Your branding, colors, and logo
- Control over exactly which features users access
- User authentication and permissions
- Mobile access through the TagoRUN mobile app, or your own branded app
Your customers see your brand, log into your portal, and use your product, with TagoIO’s infrastructure underneath. Develop once, deploy to thousands of end users under your name.
The Security Layer: Authentication and Access Control
IoT security is not just web application security. You are securing thousands of devices, each with its own authentication, plus user access to dashboards and data.
Device Authentication: Tokens and Security
Every device authenticates with a secure token, a cryptographic string granting that specific device permission to send data to its bucket. For enterprise deployments, TagoIO also supports machine certificates for stronger device authentication.
User Authentication: SSO and Identity Providers
For human users, TagoIO integrates with your identity provider:
- OAuth2 and OpenID Connect support
- SAML for enterprise SSO
- Pre-built integrations with Google, Microsoft, Okta, and others
- Two-factor authentication (2FA)
TagoIO does not store your user passwords. Authentication is delegated to your identity provider, so when an employee joins or leaves, their TagoIO access follows automatically. No manual account management.
Access Management: Granular Permissions
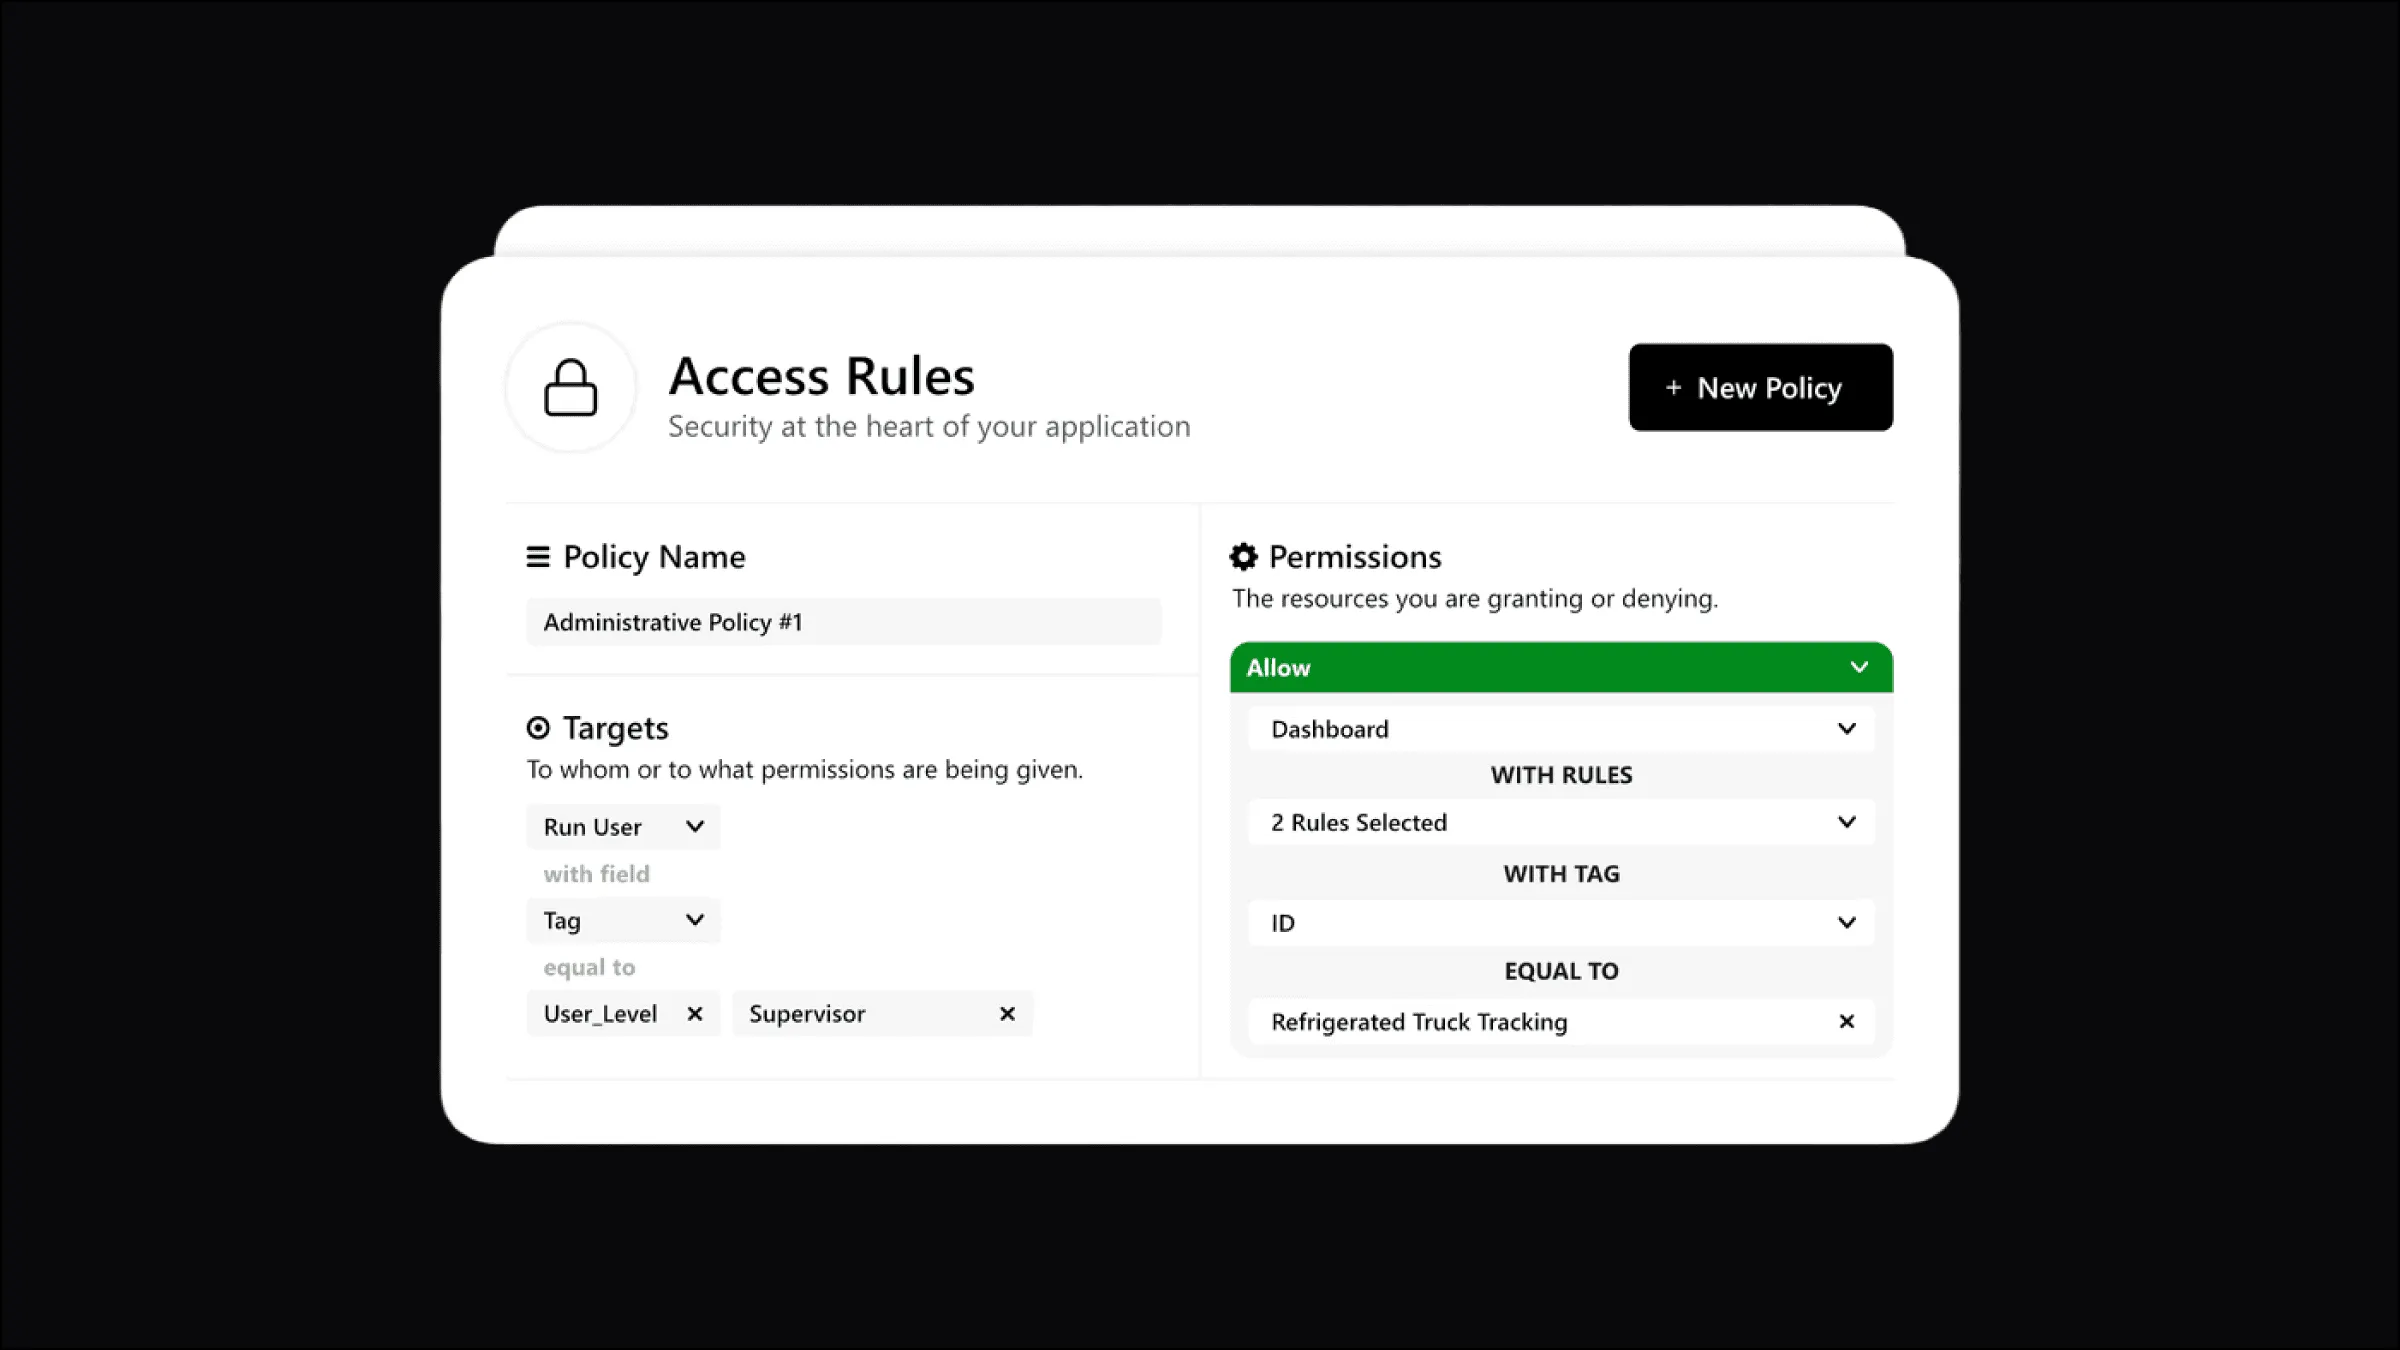
Once authenticated, Access Management controls what users can do and see:
- Resource-level permissions: which dashboards, devices, analyses, and actions each user reaches
- Role-based access control (RBAC): roles like Operator, Manager, Administrator with distinct permission sets
- Tag-based access: grant access to device groups by tag (for example, all devices tagged region:europe)
- Custom permission logic: Analysis scripts for complex rules
In a smart building application, tenants see only their floor’s sensors, facility managers see all floors without system settings, and administrators see everything.
Note: Access Management works natively with tags. Grant a user access to “all devices tagged region:north-america” and every new device with that tag is covered automatically. This tag-based approach is critical at thousands of devices and users.
The Integration Layer: Connecting to the World
No IoT platform exists in isolation. TagoIO applications integrate with payment systems, CRMs, ERPs, weather services, external databases, and more.
RESTful API: Full Platform Control
The REST API exposes virtually every platform capability: create and manage devices and data, trigger Actions and Analysis, generate tokens, manage users and permissions, create dashboards. Standard HTTP with JSON, callable from any language, with official SDKs for JavaScript and Python and a CLI for automation.
MQTT Broker: Real-Time Bidirectional Communication
For real-time device communication, TagoDeploy includes a built-in MQTT broker. Publish from devices to topics, subscribe from devices or applications, implement command-and-control, and build responsive systems. Fully authenticated with device tokens, supporting QoS 0 and QoS 1.
Webhook Actions: Push Integration
Rather than having external systems poll the API, webhook Actions push data out: when conditions are met, TagoIO POSTs device data and event information to your endpoints. This fits external analytics platforms, workflow triggers in other systems, real-time database updates, and payment events.
Pre-Built Integrations
TagoIO ships integrations with popular services:
- LoRaWAN network servers: The Things Network, The Things Industries, Actility, Netmore, Loriot, ChirpStack, AWS IoT Core for LoRaWAN, and others
- Satellite IoT providers: Myriota, Kinéis, Skylo
- Communication services: Twilio for SMS and WhatsApp, SendGrid for email
These work out of the box, saving weeks of integration development.
The Deployment Layer: Where Your Application Runs
We have covered what TagoIO does. Where it runs is the last architectural decision, and it is a business decision too.
Multi-Tenant Cloud: Fast Start, Low Cost
Sign up at admin.tago.io and you are on TagoIO’s multi-tenant cloud: shared instances with complete data isolation and security. This model fits:
- Quick prototyping and testing (start in minutes)
- Small to medium deployments
- Cost-effective scaling
- Zero infrastructure management
Shared instances use infrastructure efficiently, which is why the free tier can include so much. As you scale, you pay for what you use.
TagoDeploy: Dedicated Infrastructure
For deployments that need their own environment, TagoDeploy provides dedicated instances of the complete TagoIO platform, exclusively for your organization. One dedicated instance can host as many applications and customer tenants as your business needs; dedicated refers to the infrastructure being yours, not to a limit on what you run inside it. With TagoDeploy you get:
- Dedicated cloud infrastructure operated by TagoIO on AWS
- 12+ regional options, including the US, Ireland, Canada, Germany, the UK, Switzerland, Japan, Singapore, Australia, and São Paulo
- Full control over updates and platform versions
- Optimized costs for high-volume data processing (often far cheaper than shared instances at scale)
- Compliance for regulated industries, covered by TagoIO’s ISO 27001 certification and with regional data residency
- Customization options not available on shared instances, including custom rate limits and your own MQTT broker and API endpoints
The choice is not permanent. Many companies develop and validate on the shared cloud, then move to TagoDeploy for production scale, data residency, or custom limits.
Scaling to Production: How TagoIO Handles Massive Deployments
The question that matters when you are building a real business: how does TagoIO scale from 10 devices to 10,000 without a rebuild?
This is where many IoT projects stall. The proof-of-concept works beautifully with 50 test devices; production with thousands exposes the cracks. Permissions become a nightmare, dashboards get created by hand per customer, and automations get duplicated with slight variations.
TagoIO addresses the scaling problem with three architectural features: Tags, Blueprint Dashboards, and tag-based triggering.
Real-World Scenario: Fleet Management at Scale
Imagine a fleet management platform for a growing logistics business. The pilot monitored 50 trucks. Now you need:
- 5,000 trucks across 12 regional depots
- 2,000 users: drivers, regional managers, executives
- Multiple customers on your white-labeled platform, because you are building a fleet management service, not managing one fleet
Tags: The Foundation of Scale
Every resource in TagoIO (devices, dashboards, actions, analyses, users) carries key-value tags. A truck device might be tagged: asset type (truck), region (northeast), depot (boston), customer (acme_logistics), vehicle class (refrigerated). Those simple labels drive the automation layer.
1. Automatic permissions. One rule, “Regional Manager (Northeast) has access to all devices tagged region:northeast”, replaces per-device grants. New truck in Boston? Tag it and access follows. At 5,000 trucks, it is still one rule.
2. Targeted Actions. One “Temperature Alert, Refrigerated Fleet” Action monitors every truck tagged refrigerated. Add 500 refrigerated trucks and they are covered the moment they are tagged.
3. Filtered dashboards. A regional manager’s view shows “all trucks tagged region:northeast” and updates itself as trucks are added, removed, or re-tagged.
4. Bulk operations. Update settings on every truck in a region by querying the tag, not by clicking through thousands of devices.
Tags turn per-device configuration into policy-based management. That is how 50 devices become 5,000 without proportional operational growth.
Blueprint Dashboards: Deploy Once, Scale Forever
With 5,000 trucks and 2,000 users, manual dashboard creation is impossible. Blueprints solve it:
Step 1: Create one master dashboard showing truck telemetry: live GPS on a map, temperature and humidity graphs, fuel gauge, engine diagnostics, driver status, and the analytics layer’s outputs, like predicted range and anomaly flags. The template uses variables instead of hardcoded device IDs.
Step 2: Define assignment rules. “Create an instance of this blueprint for every device tagged asset_type:truck.”
Step 3: Automatic deployment. 5,000 dashboard instances appear, each bound to its truck. New truck, new dashboard, automatically.
Step 4: User access via tags. Drivers see their truck, regional managers see their region, executives see the aggregate view.
Step 5: Update once, deploy everywhere. Improve the blueprint and all 5,000 instances update instantly.
Tag-Based Action Triggering: Scalable Automation
Instead of 5,000 device-specific alerts, tag-based Actions cover the fleet with a handful of rules, and stay precise:
- Dynamic targeting: different thresholds by climate, “refrigerated vehicles in the Southwest above 6°C” and “in the Northeast above 2°C.” Two Actions, 5,000 trucks, each with the right threshold.
- Incremental rollouts: tag 50 trucks beta_participant:true, trigger the new alert only for them, validate, then remove the filter.
- Customer-specific logic: a pharmaceutical customer’s trucks get a certified compliance email at 2°C; everyone else gets a standard SMS at 4°C. Managed entirely through tags.
- Prediction-driven automation: the same mechanism triggers on analytics outputs, so “forecast days-to-empty below 4” or “anomaly score above threshold” opens a work order before the failure, not after.
Why This Matters: The Economics of Scale
Rough numbers for the 5,000-truck deployment, done manually: dashboard creation at 30 minutes per truck is 2,500 hours; permission management for 2,000 users is 500 hours; per-device Action setup is 833 hours; plus recurring maintenance overhead. Around $150,000 of first-year labor at $50/hour.
The TagoIO approach: about 40 hours of initial setup (blueprints, tag strategy, permission policies), automated per-truck deployment via API, and a few hours a month of maintenance. Around $5,000 of first-year labor.
The 30x difference is not even the main benefit. The main benefit is agility: when requirements change, you update one blueprint or one Action, not 5,000 configurations. You manage policies, not instances.
Scaling Beyond Devices
Building a platform business rather than a single deployment? The same architecture carries it:
- Tag devices by customer: customer:acme_logistics, customer:global_shipping
- Deploy white-labeled TagoRUN portals per customer
- Each customer sees only their devices, filtered by tag
- One blueprint serves all customers with customer-specific data
- One codebase supports unlimited customers
This is how an IoT application becomes an IoT platform business, scaling technically and commercially at once.
Note: The tag-based architecture is about maintainability as much as scale. Six months in, when you need to add a feature or fix a bug, you change once and deploy everywhere.
An entire system, thousands of devices, millions of data points, real-time visualization, forecasts, and compliance, built without managing a single server, database, or infrastructure component. That is what a full-stack IoT platform gives you.
Why This Architecture Matters
You could build this yourself with AWS, a database, and custom code, just as you could build your own VPN or CRM. What you would actually need to build:
- Multi-protocol device connectivity layer with authentication and security
- Optimized time-series databases with automatic retention and partitioning
- Serverless compute environment with event-driven triggering
- Analytics pipeline for forecasts, predictions, and anomaly detection on live telemetry
- Visual dashboard builder with dozens of widget types
- Real-time data pipeline with sub-second latency
- User authentication and granular permission system
- White-label deployment infrastructure
- Mobile applications for iOS and Android
- Global infrastructure with edge caching and CDN
- 24/7 monitoring, security updates, and support
Conservative estimate: 2-3 years, a team of 8-12 engineers, millions in development cost, then ongoing operations, security, and feature work.
Or you ship your application on TagoIO in weeks.
The architectural choices here, separating data plane from control plane, hybrid mutable/immutable storage, serverless Analysis with declarative Actions, analytics as a platform layer rather than an external pipeline, visual dashboards with white-label deployment, come from years of building production IoT systems and learning what developers actually need.
Getting Started
Everything in this article is available today, free to start:
- Sign up at admin.tago.io
- Create your first device
- Send data (emulators are provided for testing)
- Build a dashboard to visualize it
- Add an Analysis or Action to process it, and watch the analytics layer start working on your telemetry
The free plan includes most of what we covered. As you scale, you pay for what you use, and TagoDeploy is there when you need dedicated infrastructure.
From a proof-of-concept for a client to thousands of devices in production, the architecture is designed to grow with you, prototype to planet-scale.
Check out the documentation or join the community forum, where thousands of developers share solutions and practices.