
Cargo is worth more than it used to be, and it is getting hit harder. Verisk CargoNet put estimated 2025 cargo theft losses near $725 million, up 60 percent from 2024, with the average value per theft rising 36 percent to $273,990. Overall supply chain crime volume barely moved. Thieves simply got more selective about which trailers they open.
Shippers have responded by buying visibility, and most of what they bought was a map. Trackers, a dashboard, a line on a map. That works until the freight goes into a steel box, where the coordinates stop arriving and the map stops being useful. It also answers a question that rarely matters once something goes wrong. Nobody files a claim over where a shipment was. They file it over what happened to it.
The opportunity sits in the data most operations already collect and mostly ignore. A shipment leaves a fingerprint the whole way: how warm it got and how fast, whether the container was ever exposed to light, how many hours it spent moving versus sitting in a yard. That record survives the connectivity gaps. Read properly, it tells you when a problem started, what caused it, and which shipment on your board deserves attention first.
This post is about reading it: reconstructing a journey, forecasting an arrival, and flagging fraud from condition data instead of coordinates.
Steel blocks GPS, and no firmware fixes that
A loaded steel container is a partial Faraday cage, and GPS is a weak signal to begin with. Satellite signals arrive at ground level close to the noise floor, and a few millimeters of corrugated steel is enough to kill them. Stack that container three high in a vessel hold and the receiver has nothing to work with.
Placement helps at the margin. Door gaskets and vent openings leak radio energy, so a tracker mounted high in the door recess holds a fix better than one buried in the load. It does not solve the problem. On an ocean or multimodal leg, plan for gaps measured in hours or days.
No firmware update fixes steel. The design question is what you do with the signals that still work.
The signals that keep working inside the box
Temperature, ambient light, and motion need no satellite. They keep reporting from inside the container, and together they carry most of the operational story.
| Signal | What it tells you | What it cannot tell you |
|---|---|---|
| Temperature | When an excursion began, how fast it developed, whether the cause was a door or a failing unit | Where the shipment was |
| Ambient light | A sealed container is dark. Light means it was opened, or the seal is compromised | Who opened it, or whether it was authorized |
| Motion and tilt | Moving versus sitting still, dwell time at each stop, rough handling, orientation changes | Which yard it is sitting in |
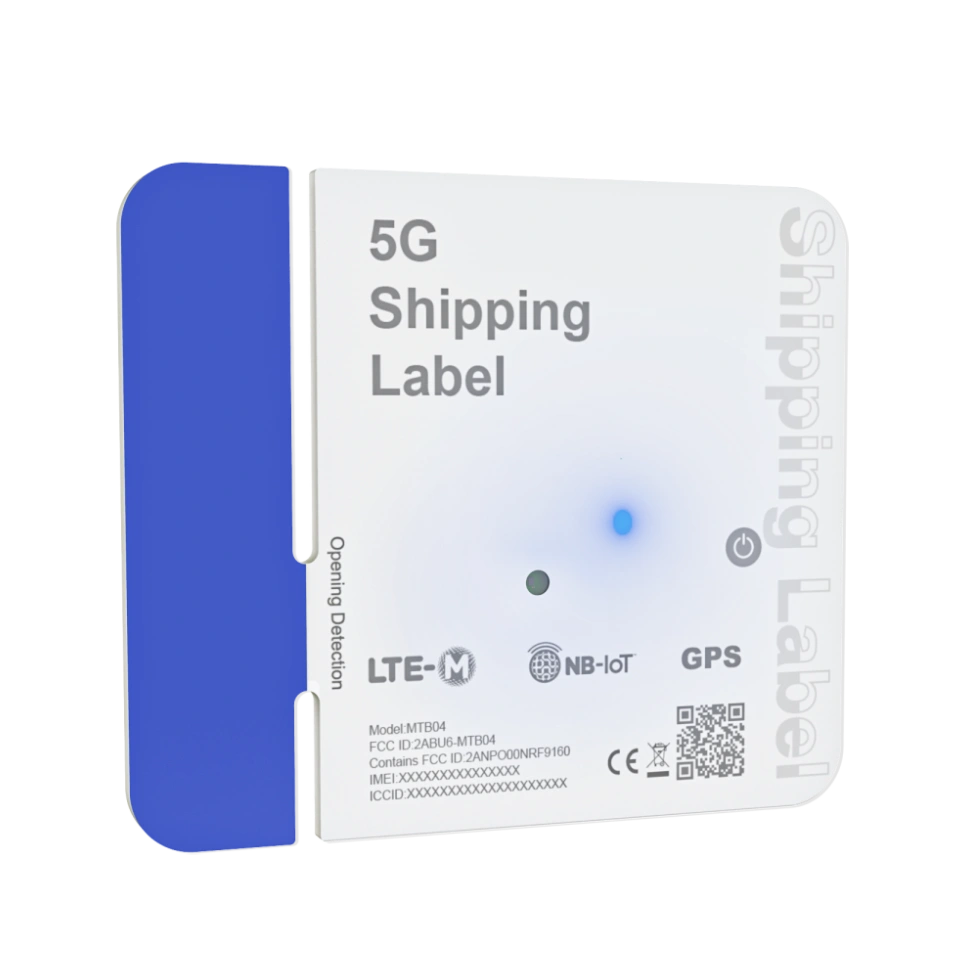
The Minew MTB04 carries all of these in one adhesive label, with onboard storage so readings survive the connectivity gaps rather than vanishing into them. That last detail matters more than it sounds: a buffered device gives you a continuous condition record even when the location record is full of holes.
How do you know a container was opened if you have no GPS fix?
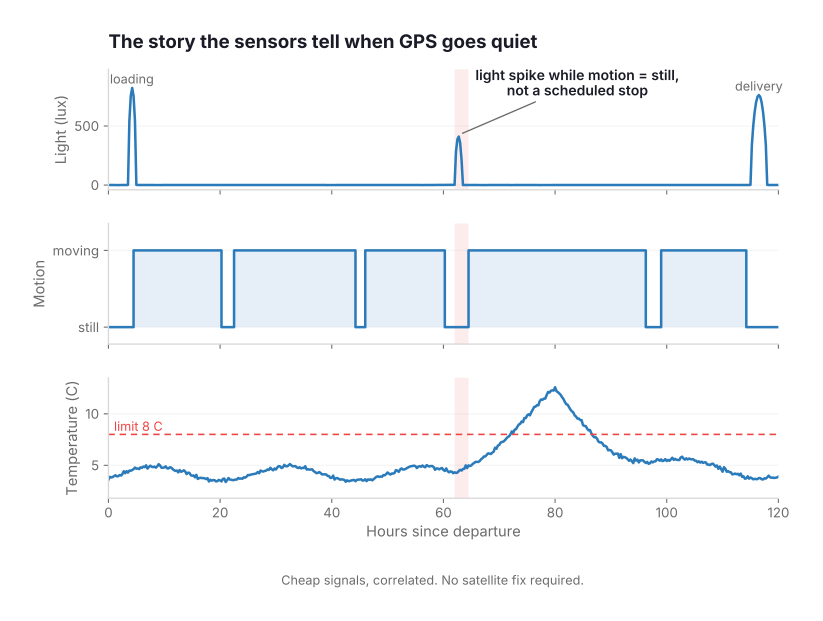
By correlating signals rather than trusting any one of them. A light event on its own is weak evidence. A light event while motion reads “still,” outside every scheduled stop window, with a temperature step starting minutes later, is a specific claim you can act on.
This matters because physical seals are not the control people assume. Thieves pull door hinge pins and swing the door open from the hinge side, leaving the bolt seal untouched. The paperwork says intact. The light sensor says otherwise.
The pattern to encode is a rule, not a threshold: light above baseline, motion below the movement threshold, timestamp outside the planned stop windows for that lane. Any of those alone produces noise. Together they produce a short list worth investigating.
Estimating ETA from progress, not position
Arrival is predicted from progress, which means an unreliable position trail is less of a handicap than it looks. The inputs that carry the ETA signal survive the gaps:
- Motion duty cycle, meaning the ratio of moving hours to still hours on this leg compared with the lane’s history
- Dwell time at each node, which is where schedules mostly go wrong
- Historical leg durations for the same origin, destination, carrier, and season
- The location points you do get, at gate-in, gate-out, port arrival, and any open-sky stretch
TagoIO Analytics turns those into a forecast without ML code. Seasonal forecasting uses MSTL decomposition with an automatically selected ETS model, so weekly and daily cycles in transit behavior get modeled instead of averaged away. Multivariate demand prediction runs Prophet fed by driver forecasts when you want weather or port congestion in the model. Time to Threshold runs its own Holt-Winters or AutoETS forecast, scans it for the crossing, and publishes an ETA in hours plus a severity tier you configure once.
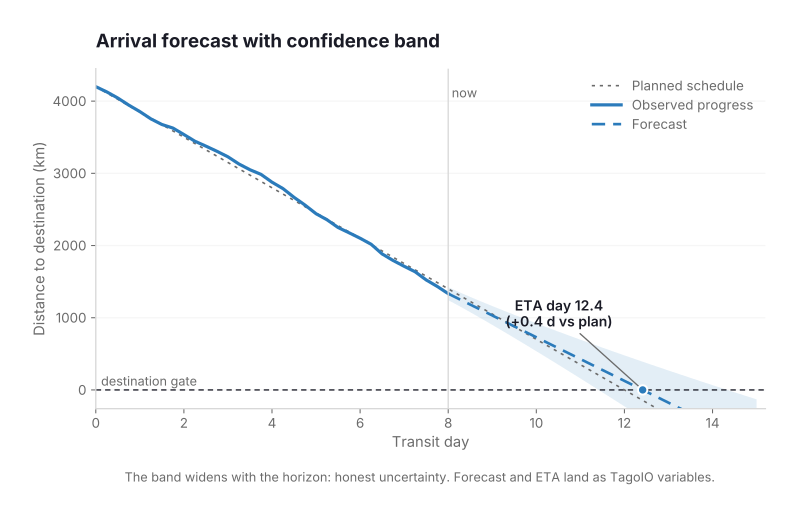
The outputs land as regular TagoIO variables: forecast values with upper and lower bounds, ETAs, severity tiers. Nothing downstream changes. Dashboards chart them, Actions trigger on them, and TagoRUN portals show them to your customers under your brand. An ETA that revises itself on every model run is worth more to a planner than a map pin that went stale fourteen hours ago.
How does anomaly detection catch cargo fraud?
By comparing a shipment against learned normal behavior instead of against a fixed limit. Fraud rarely produces one obviously bad reading. It produces a pattern that does not match how this lane usually behaves.
That is the only angle that works on the fastest-growing category of loss. CargoNet’s outlook flags theft by deception, where loads tendered to legitimate carriers get misdirected, sidestepping controls built around the tendering process itself. Deception does not break a seal or trip a threshold. It moves the load. Confirmed cargo theft incidents rose 18 percent in 2025 even as total crime volume stayed flat, which is what a shift toward this kind of scheme looks like in the numbers.
TagoIO Analytics splits “is something wrong” into questions with a model built for each:
- Is this reading unusual? An Isolation Forest scores each reading against the joint picture of normal. Temperature in range, light in range, motion in range, but that combination at 03:00 on a lane that never stops there: individually fine, collectively wrong.
- Which operating mode is this? K-Means learns the normal operating modes across your fleet and scores each reading by distance from the nearest one. A leg that matches no known mode is worth a look.
- Which unit is the odd one out? DBSCAN density clustering groups shipments that behave alike and flags the one belonging to no group. Forty labels on the same lane, one with a different motion signature, is how diversion and unit swaps surface.
- Is something slowly going wrong? An EWMA control chart tracked against a seasonal baseline catches the slow creep that defeats fixed thresholds. This is the one that finds a reefer being nursed along for weeks before anything trips a compliance limit.
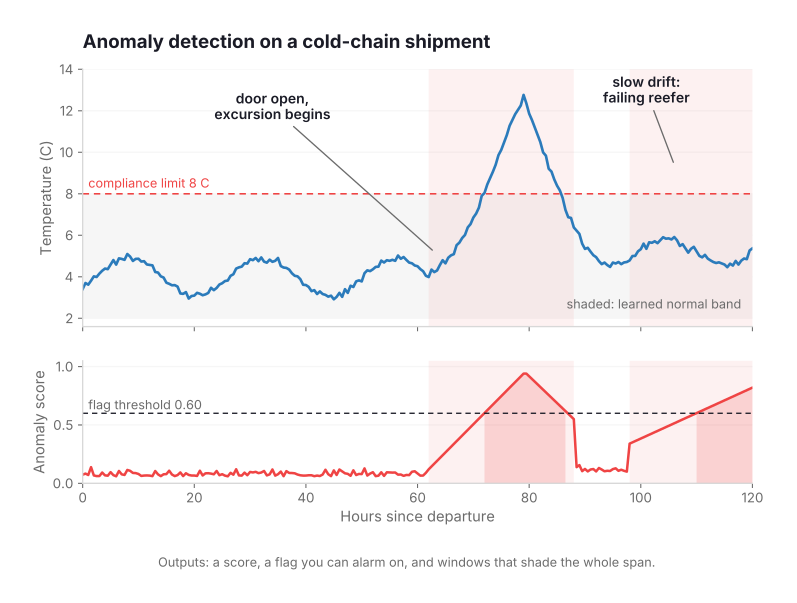
You do not need labeled fraud history for any of this. The models train on the telemetry already sitting in your device buckets.
Post-event analysis gives you cause, not just the alarm
A real-time alert says the temperature crossed 8°C. Post-event analysis says which of two very different failures happened.
A door opening produces a step: sharp rise, then exponential recovery once the door closes. A failing refrigeration unit produces drift: slow, monotonic, no recovery. Both trip the same compliance alarm. Only one is the carrier’s fault, and the shape of the anomaly window tells you which. That distinction is the difference between eating the loss and recovering it.
The same reconstruction feeds claims documentation with timestamped evidence, chain-of-custody records for regulated goods, carrier and lane scorecards built from dwell and excursion history, and a root-cause review that closes with a specific fix rather than a shrug.
The same models on assets that never move
Vending cabinets, stationary equipment, and fixed installations are the easier case. Location is already known, so every bit of value sits in the condition data.
Motion where there should be none reads as removal or tampering. Light inside a closed cabinet reads as access. A temperature trend on a cooling unit reads as compressor health, and Time to Threshold converts that trend into days until it breaches, which is a maintenance window instead of a call from an angry customer. Same models, same wizard, no location required.
What it takes to build
The Minew MTB04 handles the sensing and the uplink. TagoIO ingests the payload, stores the history, and runs the models. Analytics setup is a guided wizard: pick devices, pick signals, choose how the model should behave, install. Everything after that is the platform you already have, because dashboards, Actions, the API, and white-label portals consume predictions the same way they consume sensor readings.
Start with TagoIO Analytics for the models and TagoIO for logistics for the dashboards, geofencing, and integrations around them. The free plan gives you 5 devices and 5 dashboards, enough to wire up a label and watch the first forecast appear.
Frequently asked questions
Do GPS trackers work inside shipping containers?
Not reliably. A loaded steel container acts as a partial Faraday cage and blocks the weak GPS signal. Trackers mounted high in the door recess, near gaskets or vents, hold a fix better than units buried in the load, but multi-day gaps on ocean and multimodal legs are normal. Condition sensors such as temperature, light, and motion keep reporting regardless.
How can you tell if a shipping container was opened during transit?
A sealed container is dark inside, so any ambient light reading above baseline indicates the container was opened or the seal is compromised. Light alone is weak evidence. Correlate it with motion state and the scheduled stop windows for that lane. Light while stationary and outside a planned stop is the pattern worth investigating, and it also catches hinge-pin entry that leaves the bolt seal intact.
Can you predict shipment ETA without continuous GPS tracking?
Yes. ETA comes from progress rather than position: motion duty cycle, dwell time at each node, historical leg durations for the lane, and the location fixes you do get at gates and ports. TagoIO Analytics forecasts the trend with MSTL plus AutoETS, and Time to Threshold scans a Holt-Winters or AutoETS forecast for the arrival crossing, publishing an ETA and severity tier as variables.
What is anomaly detection in cargo monitoring?
Scoring a shipment against learned normal behavior instead of fixed thresholds. TagoIO uses Isolation Forest for unusual joint readings, K-Means for operating-mode deviation, DBSCAN for peer comparison across shipments on the same lane, and an EWMA control chart for slow drift. Outputs are an anomaly score, a flag you can alarm on, and anomaly windows with start and end times.
How do you detect cargo fraud with IoT sensors?
By looking for patterns rather than single bad readings. Diversion shows up as a motion and dwell signature unlike peer shipments on the same lane. Tampering shows up as light events outside scheduled stops. Slow degradation that stays under every fixed threshold shows up as drift against a seasonal baseline. Peer comparison and drift detection catch these without any labeled fraud history.
How much sensor history do you need before the models are useful?
Train on three to four times more history than the range you want to predict, so a one-month forecast wants three to four months of data. Seasonal models need at least two full cycles of the pattern they learn. The TagoIO setup wizard checks your window and warns you when it is short.
Can this monitor stationary assets like vending cabinets?
Yes, and location becomes irrelevant. Motion where none is expected indicates removal or tampering, light inside a closed cabinet indicates access, and temperature trend indicates cooling-unit health. Time to Threshold turns that trend into days until a breach, which converts an outage into scheduled maintenance.
Minew builds the sensing layer. TagoIO is the application layer that connects, stores, models, and shows it. See the MTB04 label on Minew’s site, and TagoIO Analytics for the models described here.