
“We can’t forecast yet, we don’t have enough data” is one of the most common reasons a predictive project never starts. It sounds responsible. It is usually wrong, or at least far too vague to act on, because the honest answer is not a fixed number of rows. It depends on the rhythm of the thing you are predicting.
The mistake underneath the excuse is treating data volume as the requirement. What a forecast actually needs is enough history to see the pattern repeat. A signal that cycles daily reaches that point in weeks. A signal that cycles yearly does not, no matter how many readings per second you collect in the meantime. Get this distinction right and you can usually start much sooner than you feared.
The rule that matters: cover the cycle a few times
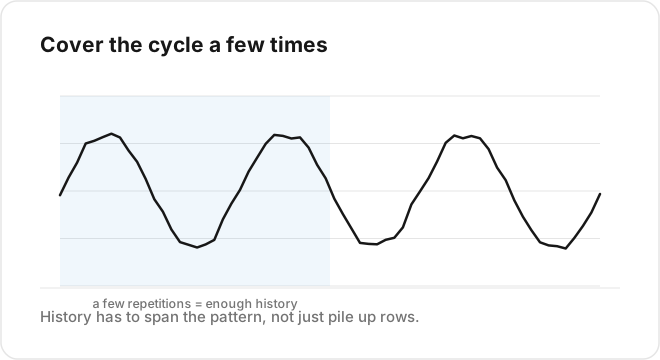
A forecast learns by seeing a pattern happen more than once. So the requirement is tied to your longest meaningful cycle, not to a row count.
If your signal repeats daily, energy load, occupancy, water use, you want at least a few weeks of history so the model sees the weekday and weekend shapes several times over. If the dominant cycle is weekly, you want a couple of months. If it is seasonal across the year, you genuinely need more than a year, and there is no shortcut, because a model cannot forecast a summer it has never seen.
High sampling frequency does not substitute for time span. A million readings from three days still only shows the model three days. For forecasting, calendar coverage beats raw volume almost every time.
More data is not automatically better
There is a second trap on the other side: hoarding years of history and feeding all of it to the model. Old data can hurt. If your process changed, a line was upgraded, a building was renovated, a tariff structure shifted, then data from before the change teaches the model a world that no longer exists. It will forecast the past.
A practical stance: use enough history to cover your cycle several times, prefer recent data, and be willing to cut off anything from before a known step change. A model trained on the last representative period usually beats one trained on everything since installation.
What you need depends on the model too
Simpler models are hungrier for structure than for volume. A seasonal baseline or a Prophet fit can produce a useful forecast from a few cycles of clean data. Deep learning models, an LSTM in particular, are the opposite: they want a lot of examples to learn nonlinear patterns, and they overfit badly on short histories, producing confident nonsense.
This is another reason to start simple. Early in a deployment, when history is thin, a seasonal model is not just easier, it is more appropriate. Save the data-hungry models for when you have both the volume and a proven need.
How to start before you have “enough”
You do not have to wait in the dark while data accumulates. Ship the simplest forecast the moment you have a few cycles, a moving average, then a seasonal baseline, and let it run. Its early predictions will be rough. That is fine, because you are also scoring it, so you learn exactly how rough and watch the error shrink as history builds.
Running a weak forecast live teaches you more than waiting for a perfect dataset. It surfaces data quality problems, gaps, and drift while the stakes are low, and it gives operators something to react to and correct. By the time you have enough history for a serious model, you have a working loop to drop it into.
The short answer
Enough history means a few repetitions of your longest important cycle, weighted toward recent data, cut at the last real change in your process. For most daily-pattern IoT signals that is weeks, not years. Start with a simple model now, score it, and upgrade as the data earns it.
The loop that makes this easy, read recent data, forecast, score, repeat, runs on a schedule in TagoIO Analytics, so you can start forecasting the week your sensors come online.
You can also find out how far your history gets you without writing anything. Sign in to TagoIO Analytics at sight.tago.io/login with your TagoIO account, pick a signal, and train a model in minutes. It produces forecasts and anomaly detection from the data you already have, with no code and no data scientist.