
Both anomaly detection and forecasting get filed under “add AI to my IoT data,” and teams often ask for one when they need the other. They sound related, and they share tooling, but they answer opposite questions. Confusing them leads to a model that technically works and still fails to help, because it is aimed at the wrong moment in time.
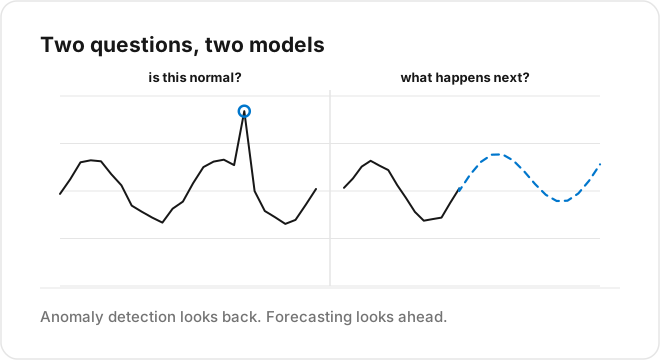
The distinction is simple once you say it plainly. Anomaly detection asks, is what just happened normal? Forecasting asks, what is going to happen next? One looks at the present against the past. The other looks at the future. Knowing which question your operators are actually asking tells you which to build, and often you will find you need both, in a specific order.
Anomaly detection: is this normal?
Anomaly detection watches the incoming stream and flags readings that do not fit the learned pattern of normal. A temperature that spikes, a vibration signature that shifts, a flow rate that drops to zero when it should not. It is about the present measured against history.
You need it when the failure mode is sudden and you cannot enumerate every bad state in advance with fixed thresholds. Static limits catch the obvious cases, too hot, too cold, but they miss the subtle ones: a value that is inside its normal range but wrong for this time of day, or a slow shift that never trips a hard limit. Anomaly detection catches the “this looks off” cases that rules cannot express.
For a deeper build on this, we covered the progression from thresholds to statistical baselines to AI-assisted investigation in a dedicated guide on detecting IoT anomalies. Anomaly detection is the right tool when the question is about right now.
Forecasting: what happens next?
Forecasting projects the signal forward so a decision can be made with lead time. When will the tank run dry? What will the load be at 4 p.m.? Is this bearing trending toward failure next week? It is about the future, and its value is measured in how much warning it buys.
You need it when the useful action requires notice. Reordering stock, scheduling maintenance, pre-cooling a warehouse, staffing for demand, none of these can be done at the moment the threshold is crossed, because by then it is too late. Forecasting exists to move the alarm earlier, from “it happened” to “it is going to happen.”
The test: when does the operator need to act?
Ask a single question about the decision you are trying to support: does the operator need to react to something that already occurred, or prepare for something that has not?
React to what occurred means anomaly detection. A freezer that just warmed up, a pump that just stalled, a reading that just went strange. Prepare for what is coming means forecasting. A freezer trending toward trouble, a tank heading for empty, a load about to peak. If the honest answer is “both,” you do not have one project, you have two complementary ones.
They work best together
The strongest predictive setups use both in sequence. Forecasting gives lead time on the expected path. Anomaly detection guards against the unexpected the forecast never anticipated, because a forecast assumes the future resembles the learned pattern, and the whole point of an anomaly is that it does not.
A cold chain example: a forecast warns that a unit will drift out of range in two hours given the current trend, which is enough time to intervene. Separately, anomaly detection catches the compressor that fails right now, an event no trend predicted. One buys time on the normal case, the other catches the abnormal one. Running both, you cover the future you can see and the surprise you cannot.
Building either on TagoIO
Both are the same shape of job on the platform: a script that reads device data, applies a model, and writes a result back as a variable that dashboards and alerts consume. An anomaly detector writes a flag or a score. A forecaster writes a predicted value and a confidence range. Because TagoIO Analytics produces forecasts and anomaly scores on a schedule or on incoming data, you can run one, the other, or both against the same device without a separate pipeline.
Decide by the operator’s moment: reacting or preparing. Then build the one that fits, and add the other when the second moment shows up. See how TagoIO Analytics runs both.
TagoIO Analytics can do both for you with no code. Sign in at sight.tago.io/login with your TagoIO account and train a model on your data in minutes to get forecasts and anomaly scores on the same device, without a data scientist.