
Every team monitoring sensors starts the same way: pick a limit, alert when a reading crosses it. Temperature above 8 degrees, vibration above 4 mm/s, current above 20 amps. For hard physical limits, that is exactly right.
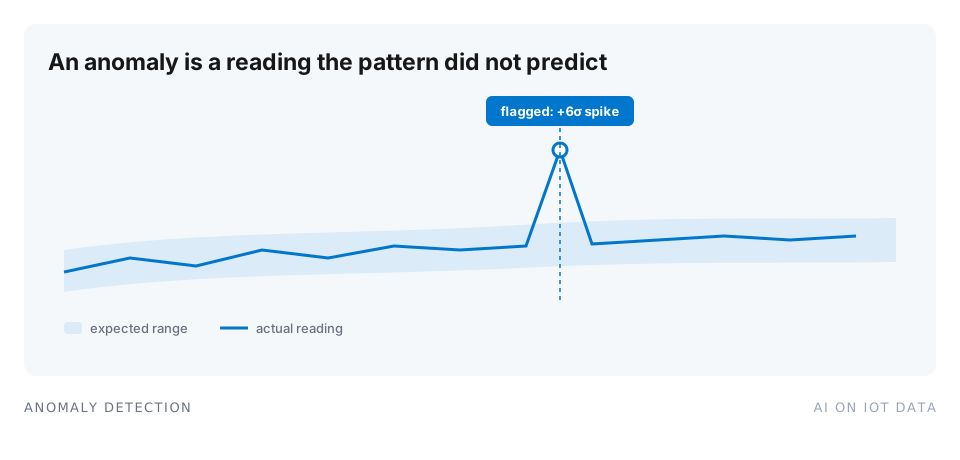
But the failures that cost real money almost never announce themselves with one out-of-range reading. They hide inside readings that look individually normal. A compressor drifts two degrees over three weeks. A flow meter goes quiet at 2 a.m. and nobody notices until the morning shift. An anomaly is not “a big number.” It is a reading, or an absence of readings, that the normal pattern would not have predicted.
The four anomaly patterns in sensor data
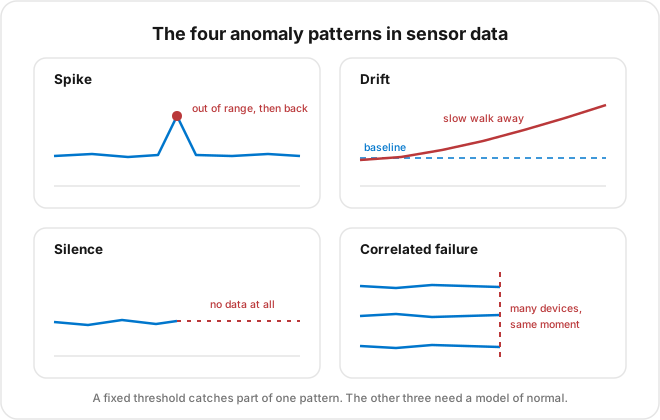
In practice, sensor anomalies come in four shapes, and only the first one is visible to a fixed limit.
Spikes are the obvious one. A value jumps far outside its recent range and returns. Some spikes are real events, many are electrical noise or a sensor glitch, and telling them apart usually requires looking at more than one reading.
Drift is slower and more expensive. A sensor, or the process behind it, moves gradually away from its baseline while staying inside the alert limits the whole way. Calibration decay, clogged filters, and refrigerant leaks all present as drift. By the time a fixed threshold finally fires, the problem is weeks old.
Silence is the anomaly most monitoring setups forget. A device that stops reporting produces no data to evaluate, so value-based rules never fire on it. Missing data is data.
Correlated failures span devices. One gateway locks up and thirty sensors go quiet together, or every unit on one electrical phase spikes at the same minute. No single-device rule sees this, because the pattern only exists across the fleet.
Detection is also a different job from prediction. If what you want is a warning before a value crosses a limit rather than a flag once it behaves oddly, that is forecasting, and the difference between the two decides which one you should build.
Thresholds and statistics: when classical methods are enough
Do not skip the classical tools, because for a large share of anomalies they are the correct answer rather than a compromise.
A static threshold is cheap, transparent, and exactly right when the limit is physical or contractual. A vaccine fridge must stay under 8 degrees, and nobody needs machine learning to enforce that. TagoIO Actions handle it directly: define the condition, define the response, done.
A statistical baseline covers the next tier. Compute a rolling mean and standard deviation per sensor, flag readings beyond three standard deviations, and you catch spikes and drift that fixed limits miss, because the band moves with the data. Segment that baseline by hour of day or operating mode and accuracy improves again: temperature that is normal at 2 a.m. may be abnormal at 2 p.m. Silence needs a different rule entirely, a timeout: if a device has not reported within twice its usual interval, that is an anomaly regardless of values.
This is unglamorous statistics, and it outperforms a naive AI model on most sensor streams because it encodes what you actually know about the process.
Where classical methods run out is exactly where the work turns tedious: choosing the right window per variable, handling seasonality, comparing behavior across hundreds of devices, correlating several variables at once. None of it is conceptually hard. All of it is hours of code and judgment calls per fleet, which is why most teams stop at thresholds and live with the blind spots. That gap is the one AI actually fills.
What AI adds, honestly
“AI anomaly detection” gets sold as a model that magically knows something is wrong. The more useful framing: AI removes the labor between knowing what a good detection pipeline looks like and having one running against your own fleet.
Trained machine learning models do earn their place at the high end, for multivariate patterns, strong seasonality, and fleets too large for per-sensor tuning. Before that point, an AI assistant that can see your real devices and data collapses the build cost of the classical pipeline itself, and that is where most teams get the fastest return.
Exploring your fleet with TagoAI
TagoAI is the AI assistant built into the TagoIO Admin, behind the star icon. It is grounded in the official documentation and in your own account: it can inspect your Devices, Dashboards, Actions, and Analysis scripts, and it is context-aware, so opening it from an Analysis or Dashboard page means it already knows what it is looking at.
The part that matters for anomaly work is that it runs data analysis operations across your devices. You can ask, in plain language, which sensors reported values more than three standard deviations from their own two-week average, which devices have gaps longer than an hour in the past day, or whether the units behind gateway 7 went silent at the same time. That is exploratory anomaly detection with no code, and it is how you learn what normal looks like in your fleet before automating anything.
It also behaves the way an assistant with account access should. You set its permission mode before you send, drop it to Read Only when you only want answers, it never changes anything silently, and everything it does is recorded in the Audit Log. The step-by-step walkthrough covers the mode switching and the habits worth building, and the provider and privacy choices are laid out separately.
Generating the detection logic as Analysis code
Exploration finds anomalies once. Production detection has to run every few minutes, unattended. On TagoIO, that is an Analysis: a script that runs on a schedule, reads recent data, applies your detection logic, and writes an anomaly flag back as a variable.
Instead of writing that script from a blank page, ask TagoAI to generate it. Because it can inspect your actual devices and data formats, the code it produces addresses your real variable names, units, and reporting intervals rather than a generic example. Describe the logic you settled on during exploration: rolling baseline per sensor, three standard deviations, segmented by hour, plus a silence check at twice the reporting interval. Review the code, adjust it, and deploy. When a script misbehaves later, TagoAI debugs it with the same account context.
The result is detection logic you can read, version, and trust, produced in minutes instead of days. The AI did the labor; the logic stays yours and stays auditable. We walked through this workflow live, from plain-language description to a running Analysis, in the webinar AI Meets IoT: A Practical Experience with TagoAI.
Alerting with Actions
Detection and alerting should stay separate. The Analysis writes an anomaly flag; a TagoIO Action watches that variable and handles the response, whether that is email, SMS, push notification, or a webhook into your ticketing system.
Keeping the two apart means you can tighten detection logic without touching alert routing, and you can route the same anomaly variable to different teams by severity.
Investigating what gets flagged
A baseline tells you Unit 4 breached at 3:20 a.m. It does not tell you why, or whether it is part of a pattern, or what to do. That investigation, correlating the breach with other variables, checking whether the same unit misbehaved last week, and drafting the fix, is exactly what an AI assistant does well when it can reach your real data.
If your assistant lives outside TagoIO, the TagoIO MCP server gives it the same reach: pull the surrounding readings, check the device’s history, and propose a tightened Action. The detection stays statistical and auditable while the AI does the tedious correlation and the first-draft response. The broader picture is in what MCP means for IoT.
A build order that survives production
Start with Actions on your true hard limits, today, no AI required. Then use TagoAI to explore how your fleet actually behaves and find which variables drift, spike, or go quiet. Next, have it generate the Analysis that encodes what you learned, and wire an Action to the anomaly flag. Add fleet-level checks for correlated failures once single-device detection is stable. Reach for trained machine learning models only when the statistical pipeline demonstrably misses patterns you care about.
The trap to avoid is starting at the end. An AI investigating anomalies you have not learned to detect reliably is a confident guess on a shaky foundation. Detection first, explanation second.
The takeaway
Anomalies in sensor data arrive as spikes, drift, silence, and correlated failures, and three of the four are invisible to fixed thresholds. Classical statistics detect them well but cost real engineering time per fleet, and that time is the cost AI removes: TagoAI to explore behavior across devices, generated Analysis code for production detection, Actions for alerting, and an assistant to investigate what gets flagged.
Build in that order and you get a system that is accurate, debuggable, and genuinely useful, rather than an impressive demo that no one trusts in production. See Analysis and Actions in the docs, or start free on TagoIO and flag your first anomaly this week.