
Most IoT projects get very good at showing you the present. A dashboard tells you the tank is at 40 percent, the motor is running warm, the freezer held temperature overnight. That answers “what is happening right now,” and for a while that is enough.
The problem is that operators do not act on the present. They act on what the present implies about the next few hours or days. Forty percent means nothing until you know whether it becomes empty on Friday or in three weeks. A dashboard that only reports the current value pushes that judgment onto a human who is watching a dozen other things. Forecasting moves that judgment into the system.
This guide walks the progression most teams actually follow, from the simplest useful forecast to machine learning, and where each one earns its place.
Start with the question, not the model
A forecast is only useful if someone changes a decision because of it. Before picking a method, write down the decision. “Reorder before the silo runs dry.” “Schedule maintenance before the bearing fails.” “Pre-cool the warehouse before the afternoon peak.” Each of those implies a horizon (how far ahead) and a tolerance (how wrong you can be before the decision breaks).
A refill decision that needs three days of lead time does not need minute-accurate prediction. It needs to be roughly right about a trend three days out. Getting this straight first saves you from building a precise model for a problem that never needed one.
Level 1: moving averages and trends
The first forecast worth shipping is often a moving average and a linear trend. Take the last window of readings, average them, fit a slope, project it forward. On TagoIO you can do this inside an Analysis script that reads a device’s recent data, computes the slope, and writes a predicted value back as its own variable that a dashboard widget can plot next to the actuals.
This sounds too simple to matter. For a slow-moving signal like a fuel tank draining at a steady rate, it is often accurate enough to trigger a reorder with days to spare. The catch is that a straight line has no idea that your building uses more energy on weekday afternoons. The moment your signal has a rhythm, a trend line flattens it into a wrong answer.
Level 2: seasonality and baselines
Most real IoT signals repeat. Energy load follows a daily and weekly cycle. Cold chain temperature swings with door openings during shift hours. Water demand rises in the morning. A forecast that ignores those cycles will over-predict on quiet days and under-predict on busy ones.
The fix is a seasonal baseline. Instead of one average, you keep an average per hour of day, or per day of week, built from historical data. The forecast becomes “the usual value for this hour, adjusted for the current trend.” This is still arithmetic you can run in a scheduled Analysis, and it handles the majority of monitoring use cases without any machine learning at all.
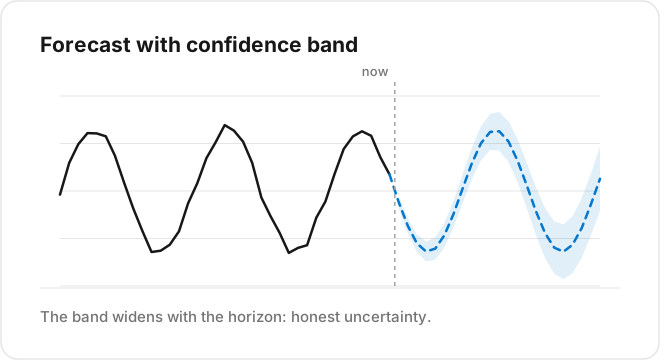
Tools like Facebook’s Prophet formalize this: they decompose a signal into trend plus daily, weekly, and yearly seasonality, and give you a forecast with a confidence range. Because you can run Python in TagoIO Analysis, a Prophet model can read a device bucket, fit, and write predictions on a schedule.
Level 3: machine learning for the hard signals
Some signals resist arithmetic. When the future depends on several inputs at once, outside temperature, occupancy, production rate, and the interactions between them, a hand-built baseline stops keeping up. That is where models like gradient-boosted trees or an LSTM network earn their cost.
These models learn patterns from history that you did not encode by hand. They also demand more: clean training data, a real evaluation step, and retraining as conditions drift. The mistake teams make is reaching for an LSTM first because it sounds serious, then spending a month on a problem a seasonal baseline would have solved in an afternoon. Machine learning is the right answer when the simpler levels have measurably failed, not before.
Because TagoIO Analytics produces the forecast next to your data, its predictions feed straight back into dashboards and alerts.
Measure the forecast, or you do not have one
A forecast you never score is a guess with a chart. Hold back recent data the model never saw, predict it, and compare against what actually happened. Track a simple error number over time. When it drifts, your model has gone stale and needs retraining or a rethink.
This step is what separates a forecast that operators trust from one they quietly ignore after it misses twice. Build the scoring in from the start, run it on the same schedule as the forecast, and surface the error on the same dashboard.
Where to start this week
Pick one signal tied to one real decision. Build the moving-average version in an Analysis script, plot the prediction next to the actuals, and let it run. You will learn more from one live forecast that is sometimes wrong than from a month of planning the perfect model. Add seasonality when the trend line embarrasses you, and reach for machine learning only when the numbers say the simpler versions are not enough.
Forecasting is not a feature you switch on. It is a habit of turning the data you already collect into the next decision, and the platform’s job is to make that loop short. See how TagoIO Analytics produces the forecasts behind it.
For the no-code path, TagoIO Analytics builds the forecast for you. Sign in to TagoIO Analytics at sight.tago.io/login with your TagoIO account and train a model on your data in minutes. You get forecasts and anomaly detection on your own signals without writing a script or being a data scientist.