
A level sensor on a tank or silo answers one question well: how much is left. You open the dashboard, you see 40 percent, and you move on. For a while that is all you need, because someone remembers to check and someone remembers to reorder.
The failure shows up at scale. When you are monitoring one tank, a human can eyeball the trend. When you are monitoring hundreds across sites, nobody can, and the reading that matters is not the level, it is the date. Forty percent is comfortable if the tank drains slowly and a refill takes a day. Forty percent is a crisis if it drains fast and the supplier needs a week. The number on the dashboard does not tell you which, and a stockout, or an emergency delivery at a premium, is what happens when you guess wrong. Forecasting turns the level into a runout date.
The signal is easy, which is the good news
Depletion is one of the more forecastable IoT signals, because most tanks and silos drain with a consistent pattern. A fuel tank feeding a steady process, a water reservoir on a daily draw, a feed bin on a herd’s routine: consumption tends to repeat, so a model has clear structure to learn from.
For a steady drain, even a moving-average rate of depletion projected forward gives a usable runout date. Where consumption follows a cycle, higher use on weekdays, seasonal demand, a seasonal model captures it. You rarely need heavy machine learning to predict a level, which means this is one of the fastest forecasts to get into production.
What to predict: the date, not the level
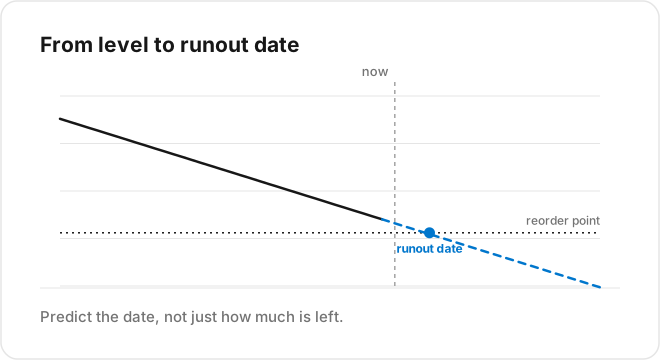
The useful output is not “predicted level next Tuesday.” It is “days until this tank reaches the reorder point.” That framing matters because it maps directly to the decision. Set the reorder point at the level that leaves enough buffer for your real lead time, then forecast when the tank will hit it.
Get the lead time right and the reorder point almost sets itself. If a refill takes three days door to door, the reorder point is the level three days of typical consumption above empty, plus a safety margin for a bad week. The forecast then tells you the date you cross it, which is the date you place the order.
The drivers that change the drain rate
A pure “current rate continues” forecast is fine until the rate changes, and for tanks and silos the rate usually changes for knowable reasons. Production schedule drives industrial consumption. Weather drives heating fuel and irrigation water. Herd size and feed schedule drive an agricultural silo. A forecast that ignores these will be confident and wrong right when demand shifts.
Where a driver is available as data, feed it into the model. A TagoIO Analysis can pull a weather forecast for a heating-oil tank, or read a production schedule, and adjust the predicted drain rate accordingly. When drivers are not available, lean on the seasonal pattern and widen the safety margin to cover the uncertainty.
From forecast to refill
The point of the runout date is to trigger action without a human watching every tank. The loop: a scheduled Analysis reads each tank’s recent level history, estimates the drain rate, projects the runout and reorder-point dates, and writes them back as variables per device, selected by tags so the same script runs the whole fleet. An alert fires when a tank’s forecast reorder date falls inside the ordering window, routed to whoever places the order, by email, SMS, or a webhook into a procurement system.
That turns replenishment from “someone remembered to check” into “the system flags the tank that needs ordering, with enough notice to order normally instead of in a panic.” Across a fleet, that is the difference between routine logistics and recurring emergencies.
Start with your worst stockout
Pick the tank or product where running dry hurts most, or where you have paid for an emergency delivery. Build the drain-rate forecast for it, set the reorder point from your true lead time, and wire the alert to the person who orders. Prove it on one, then roll the same tag-based script across the fleet.
A silo monitoring setup that predicts depletion instead of just reporting it is a common first predictive win, because the signal is easy and the payoff is concrete. See how TagoIO Analytics runs the depletion forecast and drives the refill alert.
If you would rather not script the drain-rate model, TagoIO Analytics forecasts depletion for you. Sign in at sight.tago.io/login with your TagoIO account and train a model on your level data in minutes, with forecasts and anomaly detection, and no data scientist required.