
Sub-metering a building or a site gives you a clear picture of what you used. You can see yesterday’s peak, last month’s total, which floor draws the most. That visibility already pays for itself in spotting waste and validating bills.
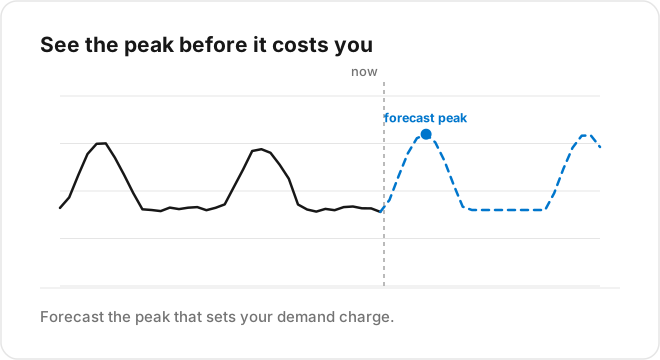
The trouble is that energy decisions are about tomorrow, not yesterday. Demand charges are set by the single highest peak in a billing period. Battery dispatch, load shifting, and buying energy ahead all depend on knowing the load before it arrives. A meter that only reports the past leaves the money on the table, because the actions that cut cost have to happen before the peak, not after you see it on a chart. Forecasting is how you get ahead of it.
Energy load is one of the friendliest signals to forecast
Good news first: electrical load is one of the more predictable IoT signals, because it is driven by human and seasonal rhythms that repeat. A commercial building follows a daily curve, low overnight, ramping in the morning, peaking in the afternoon, and a weekly one, weekdays unlike weekends. Layer in a yearly cycle from heating and cooling and you have a signal with strong, stable structure.
That structure means you do not need exotic modeling to get a useful forecast. A seasonal model that captures hour-of-day and day-of-week patterns will get you most of the way for a typical building. This is the same seasonal-baseline approach that works across IoT monitoring, and energy is where it shines, because the cycles are so consistent.
The driver that breaks a pure calendar model: weather
A calendar-only forecast assumes every Tuesday in July looks the same. Then a heat wave arrives and cooling load blows past the prediction, exactly on the day the forecast mattered most for a demand charge.
Temperature is the dominant external driver of energy load in most buildings, so a serious forecast has to include it. In practice that means pulling a local weather forecast into your model as an input alongside the calendar features. Because a TagoIO Analysis can call an external weather API, you can feed tomorrow’s forecast temperature into today’s load prediction. Adding weather is usually the single biggest accuracy gain over a calendar-only baseline for energy signals.
Other useful drivers, depending on the site: occupancy, production schedule, and known events like a shift change or a planned shutdown. Each is another input the model can learn from.
From forecast to money
A load forecast is only worth building if it drives an action. The common ones:
Peak avoidance. If the forecast says you will hit a new monthly peak this afternoon, you can shed non-critical load or dispatch a battery before the peak sets your demand charge for the whole period. This is often the largest single saving from an energy forecast.
Procurement and shifting. Knowing tomorrow’s load profile lets you buy energy or shift flexible loads into cheaper windows.
Budgeting and anomaly context. A month-ahead consumption forecast gives finance a number to plan against, and it doubles as context for anomaly detection: consumption far above forecast is a signal something is wrong, a stuck damper, a failed control, a leak.
Building it on TagoIO
The loop fits the platform directly. Meter data lands on TagoIO. A scheduled Analysis reads the recent load history for a meter or a group selected by tags, pulls a weather forecast, runs a seasonal or machine learning model, and writes the predicted load back as a variable. A dashboard plots forecast against actual, and an alert fires when the forecast projects a new peak with enough lead time to act.
Because TagoIO Analytics produces the load forecast beside your meter data, the weather-informed model lives in one place, not in a separate system you have to sync.
Start with peak, add weather, then act
Begin with a seasonal forecast of the metric that costs you the most, usually peak demand, and plot it against actuals so you can see how it does. Add weather as an input, because for energy it is almost always the biggest single improvement. Then wire the forecast to one action, peak shedding or battery dispatch, and let it start paying for itself.
See how TagoIO Analytics runs the weather-informed model behind an energy forecast.
The no-code path is TagoIO Analytics, which forecasts energy load for you. Sign in at sight.tago.io/login with your TagoIO account and train a model on your meter data in minutes, with forecasts and anomaly detection, and no data scientist required.