
Most demand forecasts are built on sales history. That tells you what you shipped, which is a decent proxy for demand until you look closely. Sales data hides the demand you failed to meet, the customer who found the shelf empty and went elsewhere, and it lags reality by however long it takes to close the books.
IoT changes the input. A connected dispenser, a monitored bin, a metered line, and a tracked asset all measure consumption as it happens, at the point where it happens. That is closer to true demand than an invoice, and it arrives in real time instead of at month end. The catch is that raw consumption readings are not a forecast, they are the raw material for one, and turning the stream into a number the business can plan against takes a few deliberate steps. Here is the path.
Why IoT data is a better base for demand
Sales figures answer “what did we sell.” Consumption data answers “what did people actually use,” and the gap between those two is exactly the information a demand forecast needs. A vending machine that reports stock levels shows demand even for the item that sold out at noon and stopped generating sales for the rest of the day. A monitored tank at a customer site shows their real usage rate, not just the timing of their orders.
Because the signal is measured at the source and in real time, it also updates far faster than a sales-driven forecast. You see a demand shift as consumption moves, not weeks later when the reorder pattern finally reflects it. For anything that turns over quickly, that speed is the advantage.
Step one: turn readings into a demand series
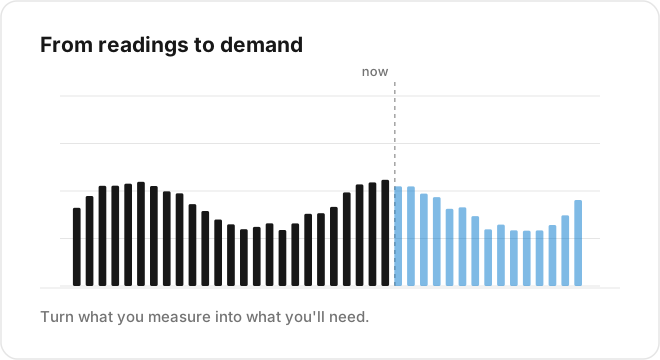
Raw IoT data is not demand yet. A level sensor reports how full a tank is; demand is how fast it empties. So the first step is deriving a consumption series from the state series: differencing levels into a usage rate, counting dispense events, or summing metered flow per period. This is a simple transform in a TagoIO Analysis that reads the raw variable and writes a clean per-hour or per-day consumption variable.
Get this layer right, because everything downstream forecasts the derived series, not the raw readings. Handle the obvious traps here too: a refill looks like negative consumption and has to be filtered, and a sensor gap should not read as zero demand.
Step two: forecast the demand series
With a clean consumption series, this is ordinary time-series forecasting. Demand usually carries strong seasonality, time of day, day of week, and often a yearly pattern, so a seasonal model is the right starting point, and the same progression applies as any IoT forecast: seasonal baseline first, machine learning only when a signal depends on several drivers and the simpler model has measurably failed.
Demand forecasts especially benefit from external drivers. Weather moves consumption of many products. Promotions, holidays, and local events move it sharply. Where you have that data, feed it in, because a demand spike around a known event is predictable only if the model knows the event is coming.
Step three: forecast per unit, then aggregate
A single blended demand number hides the detail operations needs. The stronger pattern is to forecast at the unit level, per machine, per site, per SKU, using tags to run one script across the whole fleet, and then aggregate. That gives you both the total for planning and the breakdown for action: which sites are trending up, which product is about to run short where.
Aggregating unit-level forecasts also tends to be more accurate than forecasting the blended total directly, because each unit’s pattern is cleaner than the noisy sum, and it lets you route each local signal to the person who acts on it.
From forecast to decision
A demand forecast earns its cost when it drives stocking, production, and distribution. Replenishment: send stock to the machine or site the forecast says will run short, before it does. Production planning: schedule output against predicted demand rather than last month’s sales. Distribution: position inventory where demand is trending, not where it was.
On TagoIO the loop is familiar. Devices report consumption, a scheduled Analysis derives the demand series and forecasts it per unit, and predictions are written back as variables that feed dashboards, alerts, and downstream systems through the API. With TagoIO Analytics, the weather-and-event-aware demand forecast lives next to the consumption data.
Start with one product and one decision
Pick a product where stockouts or overstock cost you, derive its consumption series, forecast it per unit, and wire the forecast to one decision, replenishment is usually the fastest to show value. Prove it on one product line, then scale the same tag-based approach across the catalog.
IoT gives you demand measured at the source in real time. See how TagoIO Analytics turns that stream into a forecast the business can plan against.
TagoIO Analytics can build the demand model for you with no code. Sign in at sight.tago.io/login with your TagoIO account and train a forecast on your consumption data in minutes, anomaly detection included, without a data scientist.