
Most IoT projects stop at the dashboard. Sensors stream temperature, vibration, pressure, and current into charts, and the team watches. Dashboards are good at their job: they show what happened. The problem is that nothing on a dashboard tells you a pump will trip next Thursday.
Analytics models close that gap. They learn the normal behavior of each asset from its own history, then score every new reading against that pattern. The output is not another chart to interpret. It is a probability, a forecast, or a countdown you can act on: order the part, schedule the crew, shift the load before the peak.
This article covers what an analytics model actually is, why a fitted statistical model beats a general-purpose AI model at scoring telemetry, which model family answers which question, and what published research says about the payoff. For the primer on descriptive versus predictive versus prescriptive analytics, start with what predictive analytics for IoT means.
How IoT analytics works, from sensor to decision
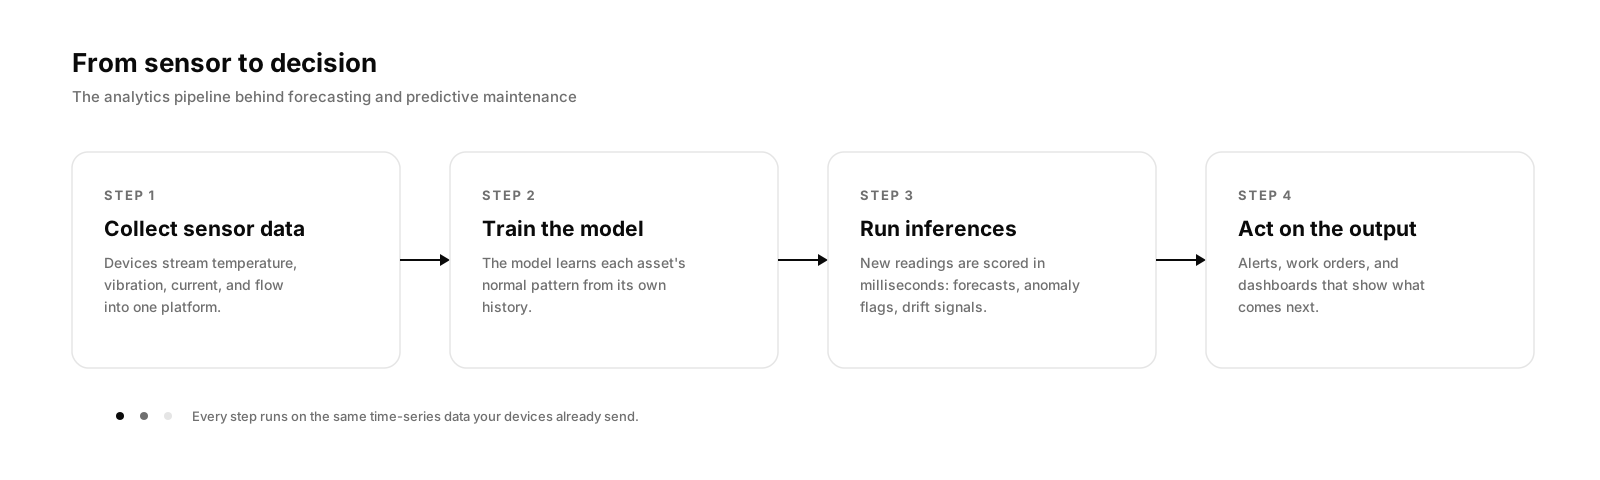
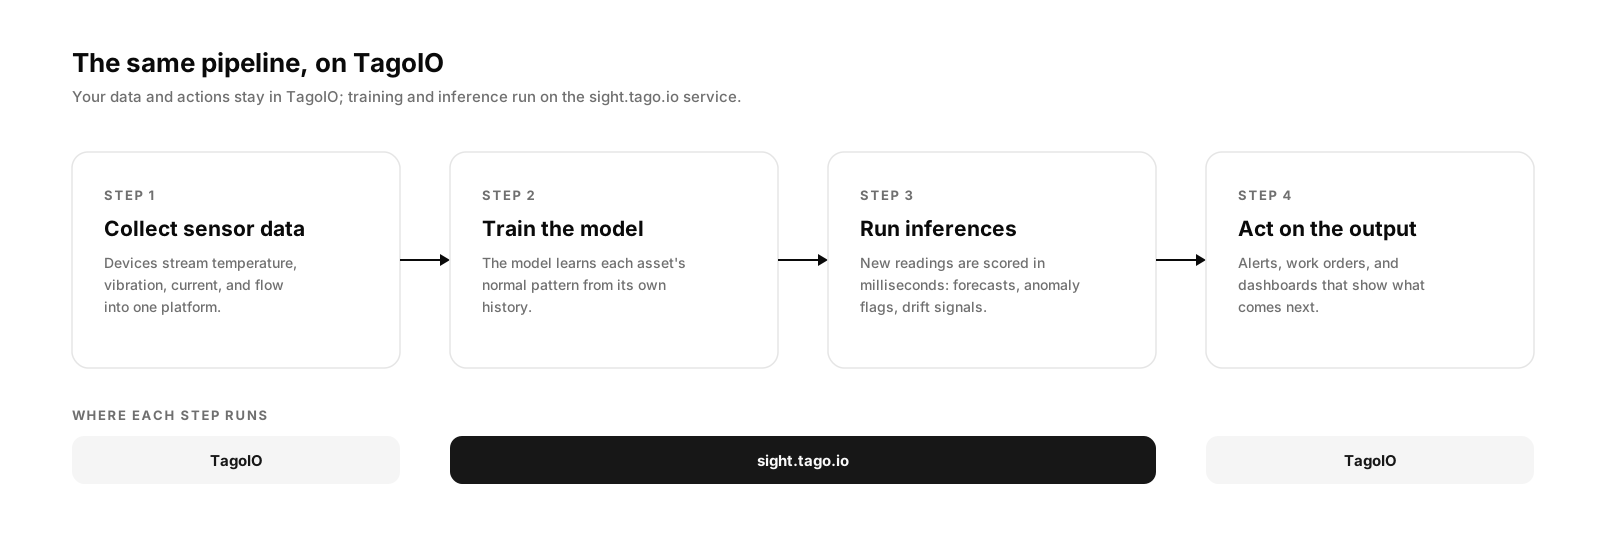
The pipeline runs in four steps: collect data from sensors, train a model on that history, run inferences on new readings, and act on the output.
Collection is the part most IoT teams already have. Devices report on a schedule, the platform stores the readings as time series, and a few weeks of history accumulate. That history is the raw material for everything else. How much of it you need depends on the model and on the seasonality you are trying to capture, which is a question worth answering before you train anything.
Training happens occasionally. The model reads the history once and extracts the structure: the daily cycle, the weekly cycle, the trend, the relationship between variables. Inference happens continuously and costs almost nothing. Each new reading is scored against the learned pattern in milliseconds. For the mechanics of where training runs and where scoring runs, see running machine learning on IoT data.
The last step is where the value shows up. A forecast that crosses a limit can open a work order. An anomaly score can page a technician. A demand prediction can land on the same dashboard the operations team already uses, next to the live readings.
What is an analytics model in IoT?
An analytics model is a mathematical description of how a variable behaves over time, fitted to your own sensor data. Once fitted, it answers questions the raw data cannot: what this sensor will read next week, whether today’s vibration pattern is unusual, how many days remain until a tank hits its limit.
The model also changes what a KPI can be. Uptime last month and average temperature yesterday are backward-looking numbers; they describe a past nobody can change. A model produces forward-looking KPIs: probability of failure this month, days to threshold, a health score per asset, forecast demand with a confidence interval. Those are the KPIs a person can act on, because the event they describe has not happened yet.
Confidence intervals matter more than they look. A forecast of “82 kWh tomorrow, between 76 and 88 with 95% confidence” lets you plan with known risk instead of a gut feeling. That is the difference between glancing at a chart and making a decision you can defend.
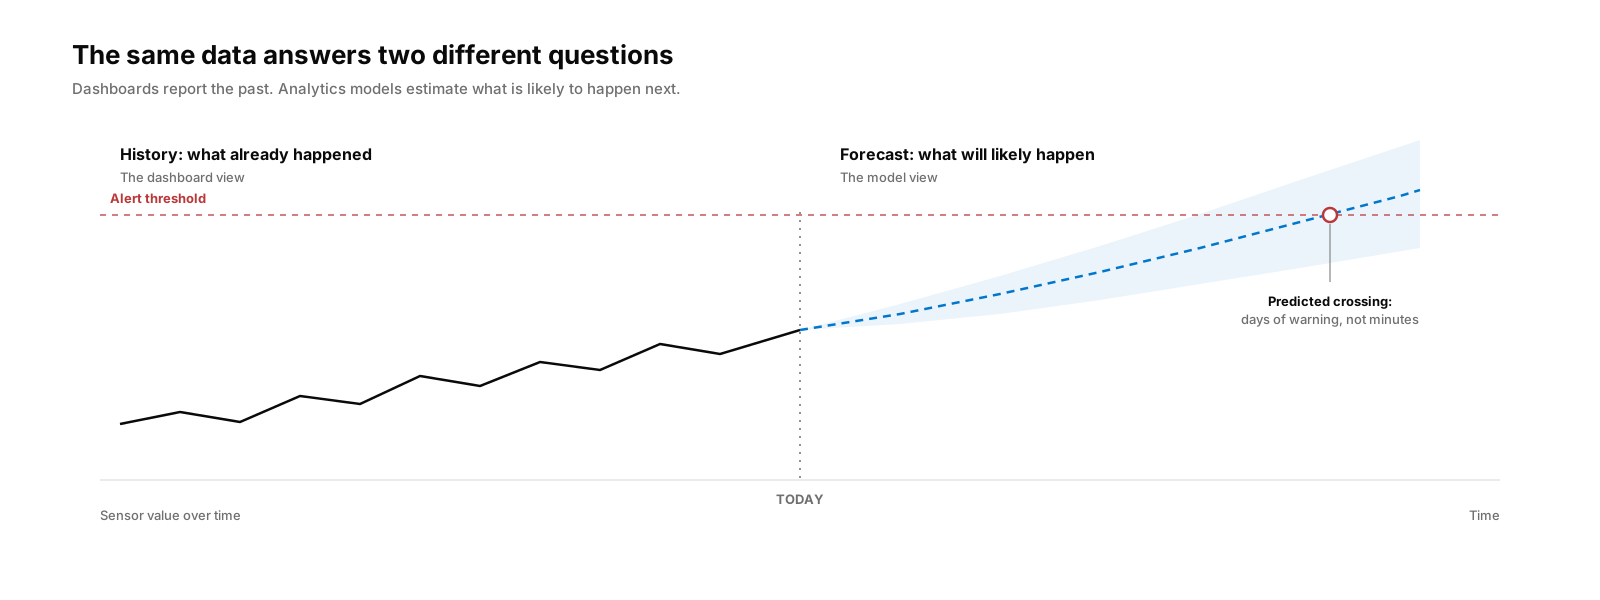
Dashboards stay in the picture. The point is not to replace them but to change what they display: model outputs arrive as new variables, so the same screen that shows the last 24 hours can also show the next 7 days.
| Dashboards | Analytics models with good KPIs | |
|---|---|---|
| Question answered | “What happened?” | “What is likely to happen, and how sure are we?” |
| Time horizon | Past to present | Present to future |
| Output | Charts a person interprets | Forecasts, probabilities, anomaly scores |
| How action starts | Someone notices, then reacts | Alerts and work orders fire before the failure |
| Decision support | Context and audit trail | Lead time and quantified confidence |
Why use statistical models instead of AI to analyze sensor data?
Because scoring sensor data is a numeric problem, and a trained model solves it for a tiny fraction of what general-purpose AI costs. Large language models are built for text and reasoning. Pointing one at raw telemetry means paying GPU prices, on every question, for arithmetic a fitted model runs on a CPU in milliseconds.
The structural difference is where the reading happens. A statistical model reads your history once, during training. After that, each inference only touches the newest data points. An AI assistant asked “is this compressor healthy?” has no fitted model to lean on, so it would need to re-process the relevant data every single time. Nobody wants an LLM re-reading billions of data points because someone asked a question twice.
Determinism is the other gap. A fitted model gives the same answer for the same input, with a confidence interval you can audit and explain to an operations manager or a regulator. Generative AI output can vary between runs, which is a poor fit for an alert that wakes someone at 3 a.m.
| Trained analytics models | General-purpose AI (LLMs) | |
|---|---|---|
| Built for | Numeric time series | Language and general reasoning |
| Hardware per inference | CPU | GPU clusters |
| Cost per inference | Fractions of a cent | Orders of magnitude higher |
| Latency | Milliseconds | Seconds |
| Data handling | Trains once on history, scores only new points | Re-processes data on every question |
| Repeatability | Deterministic, same input, same output | Output can vary between runs |
| Explainability | Trend, seasonality, and thresholds you can audit | Difficult to audit |
| Scaling to a fleet | Thousands of devices scored continuously at flat cost | Cost grows with every token processed |
AI still earns its seat. Assistants are useful for building solutions, writing scripts, and explaining results, and you can ask your IoT data questions in plain language through one. The continuous, high-volume scoring of sensor data is a job for models, the same way you would not hire a consultant to add up a spreadsheet every hour.
Which model fits which problem?
Start from the question you need answered, then pick the family.
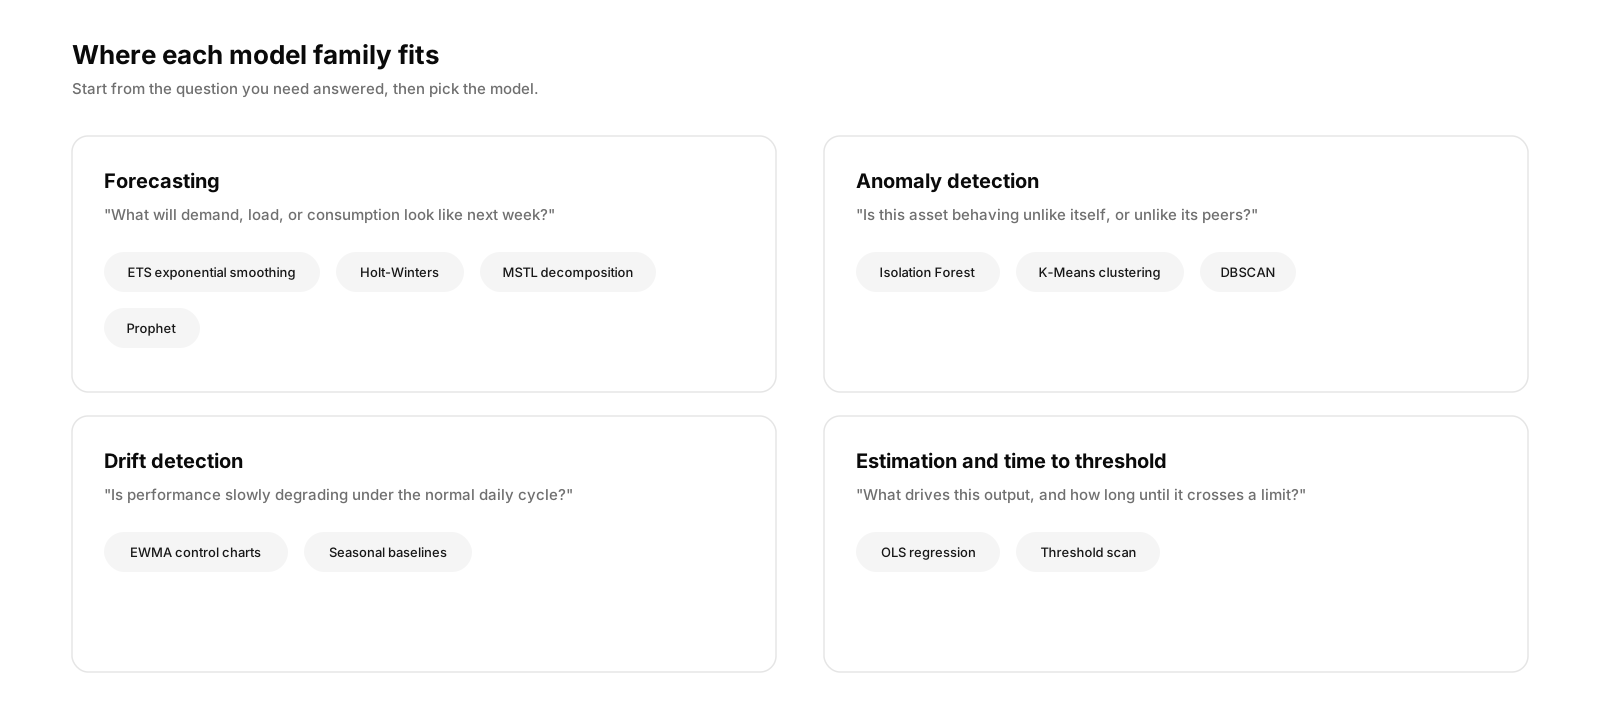
Forecasting answers “what will this variable look like next?” Exponential smoothing (ETS) and Holt-Winters project a series forward by weighting recent history and its seasonal cycles. They are the workhorses of the field, covered in depth in Forecasting: Principles and Practice by Hyndman and Athanasopoulos at Monash University. MSTL decomposition handles series with several seasonal patterns at once, like energy use with both a daily and a weekly cycle. For how ARIMA, Prophet, and the neural options compare on a single series, see which forecasting model fits your IoT time series.
Anomaly detection answers “is this normal?” K-Means clustering, a staple of Stanford’s machine learning curriculum, groups an asset’s operating states so new readings that fit no cluster stand out. DBSCAN finds density-based groups, which makes it useful for spotting the one device behaving unlike its peers. Isolation Forest separates outliers quickly even in large datasets. Detection and forecasting solve different problems, and reaching for the wrong one is a common early mistake.
Drift detection answers “is this slowly getting worse?” EWMA control charts, documented in the NIST/SEMATECH e-Handbook of Statistical Methods, weight recent readings against a baseline and flag small, persistent shifts long before they trip a fixed threshold. Fouling filters, wearing bearings, and drifting calibration all look like this.
Estimation and time to threshold answer “what drives this output, and how long do I have?” Multivariate regression estimates a target from its drivers, useful when the thing you care about has no direct sensor. Pairing a forecast with a threshold scan turns “the tank is at 63%” into “the tank reaches its limit in about 9 days,” which is a maintenance schedule, not a chart.
Does predictive maintenance actually pay off?
Published numbers say yes. The U.S. Department of Energy’s Operations & Maintenance Best Practices Guide estimates that a functioning predictive maintenance program saves 8% to 12% over a preventive program, and 30% to 40% for facilities coming from reactive, run-to-failure maintenance. Pacific Northwest National Laboratory maintains the same guidance: condition-based scheduling beats both the calendar and the breakdown. A peer-reviewed survey of predictive maintenance in Industry 4.0 reaches the same conclusion across dozens of studies. The technique works when the data pipeline behind it works.
Deloitte’s uptime and maintenance-cost figures are broken down in simplifying predictive maintenance, so they are not repeated here.
One honest caveat: the gains depend on acting. A prediction nobody routes into a work order is just another chart. The action step of the pipeline is not optional.
Getting started without a data science team
Everything above can be built by hand with open-source libraries, somewhere to run them, and someone to maintain the pipeline. That is a real project: data extraction, retraining schedules, model storage, and wiring outputs back into alerts.
TagoIO Analytics packages that pipeline into the platform your devices already report to. You pick a variable, a wizard trains the model on the data you already own, and predictions come back as regular variables. They land on dashboards, trigger Actions, and feed alerts with no ML code involved.
The heavy steps, training and inference, run on the sight.tago.io service, while your data, dashboards, and Actions stay in your TagoIO account. The pipeline from the top of this article maps onto it directly.
The model list maps onto the families above: Seasonal Forecasting (MSTL decomposition with ETS exponential smoothing), Demand Prediction (Prophet with driver forecasts), Estimation from Drivers (multivariate OLS regression), Quick Health Check (Isolation Forest), Continuous Monitoring (K-Means clustering), Peer Comparison (DBSCAN density clustering), Slow Drift Detection (EWMA control chart on a seasonal baseline), and Time to Threshold (Holt-Winters or AutoETS forecast with a threshold scan).
If your sensors are already sending data, the training step starts from history you already own. See the models at tago.io/analytics, or book a demo to walk through one on your own readings.
Sources
- Hyndman, R.J. and Athanasopoulos, G. (Monash University), Forecasting: Principles and Practice, 3rd ed.
- Taylor, S.J. and Letham, B., Forecasting at Scale (Prophet), PeerJ Preprints
- Liu, F.T., Ting, K.M., and Zhou, Z.-H., Isolation Forest, IEEE ICDM 2008
- Ng, A. (Stanford University), CS229 Lecture Notes: The k-means clustering algorithm
- NIST/SEMATECH, e-Handbook of Statistical Methods: EWMA Control Charts
- U.S. Department of Energy, Operations & Maintenance Best Practices Guide, Release 3.0
- Pacific Northwest National Laboratory, O&M Best Practices: Maintenance Approaches
- Predictive maintenance in Industry 4.0: a survey of planning models and machine learning techniques, peer-reviewed survey